. 2008 Dec 26;135(7):1299-310.
doi: 10.1016/j.cell.2008.12.006.

Germline competent embryonic stem cells derived from rat blastocysts

Affiliations

Germline competent embryonic stem cells derived from rat blastocysts

Ping Li et al. Cell. .

Abstract

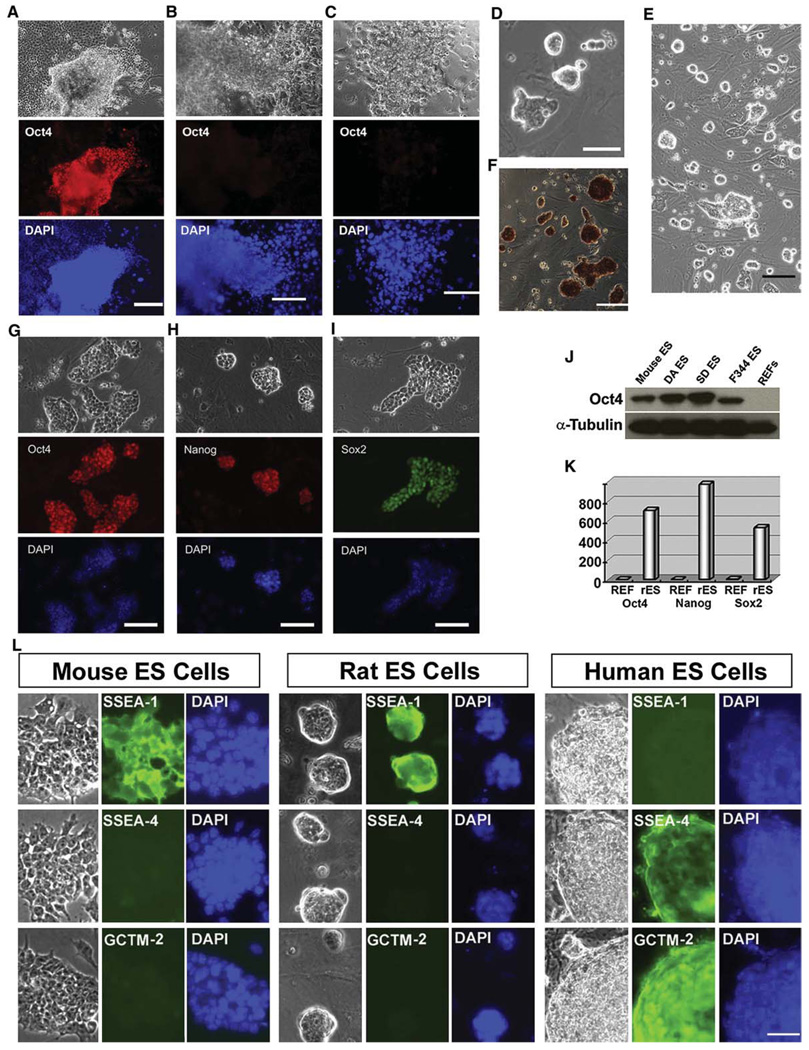
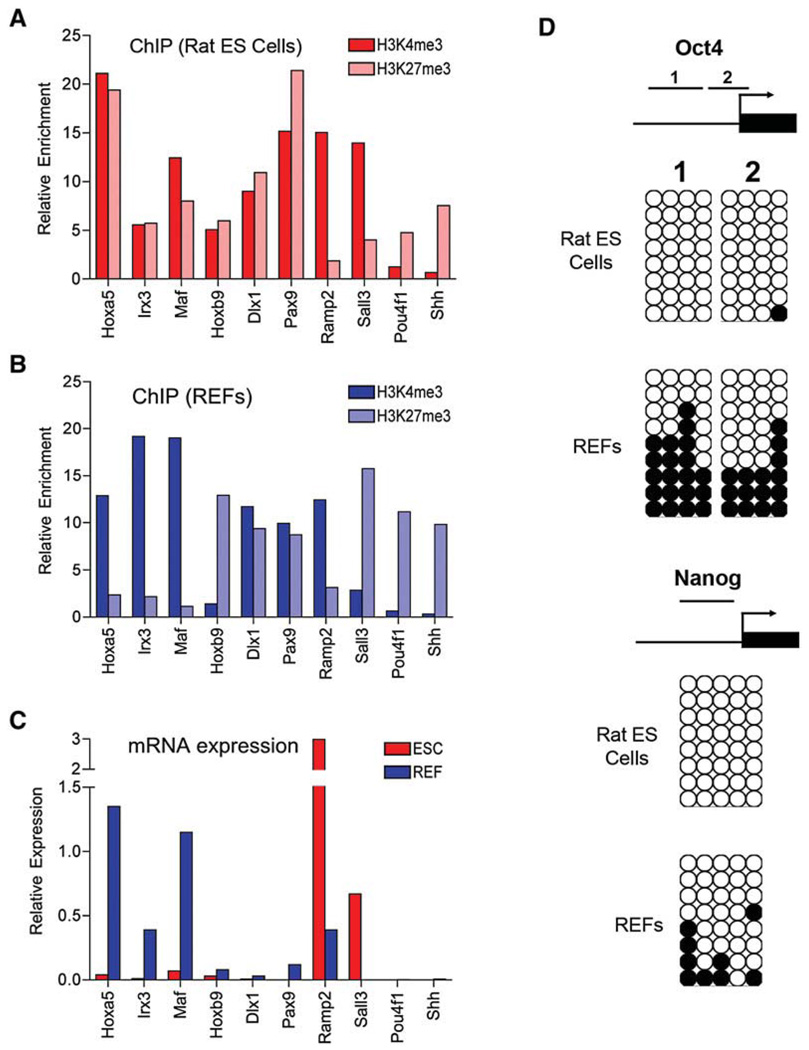
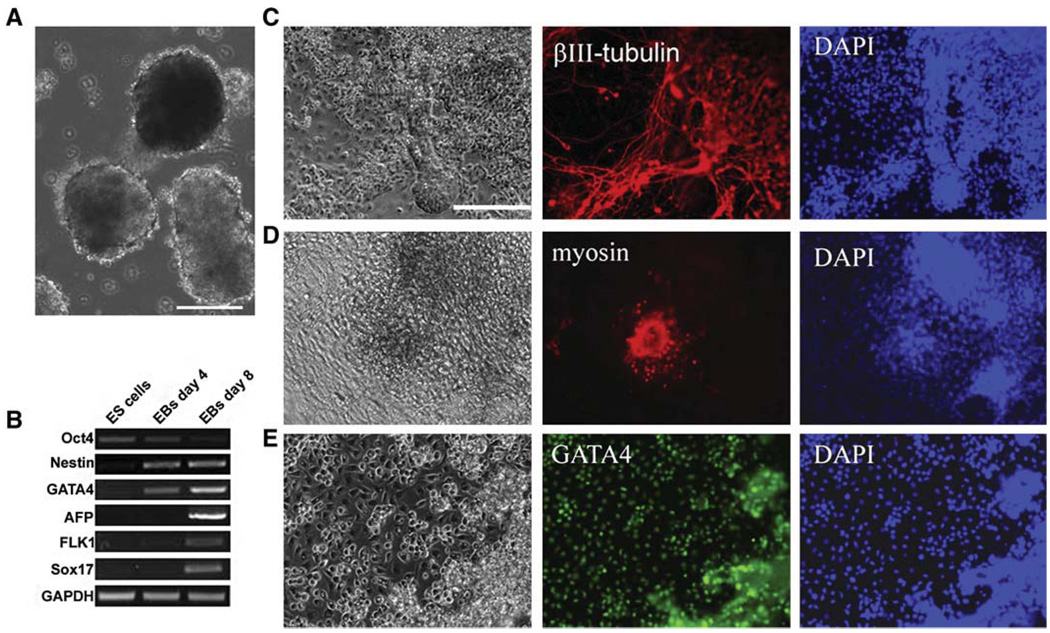
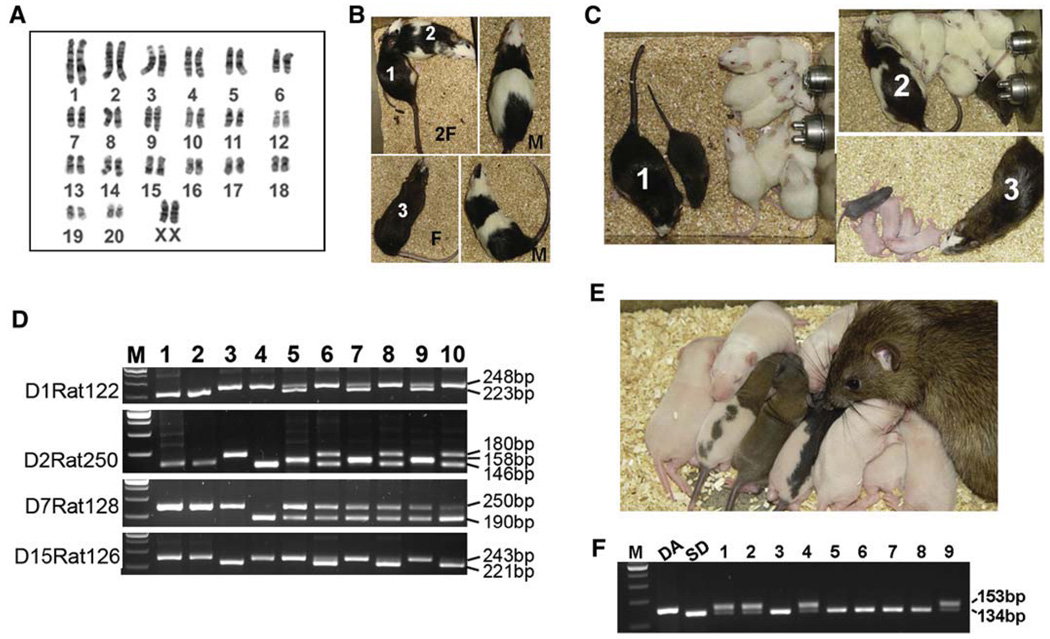
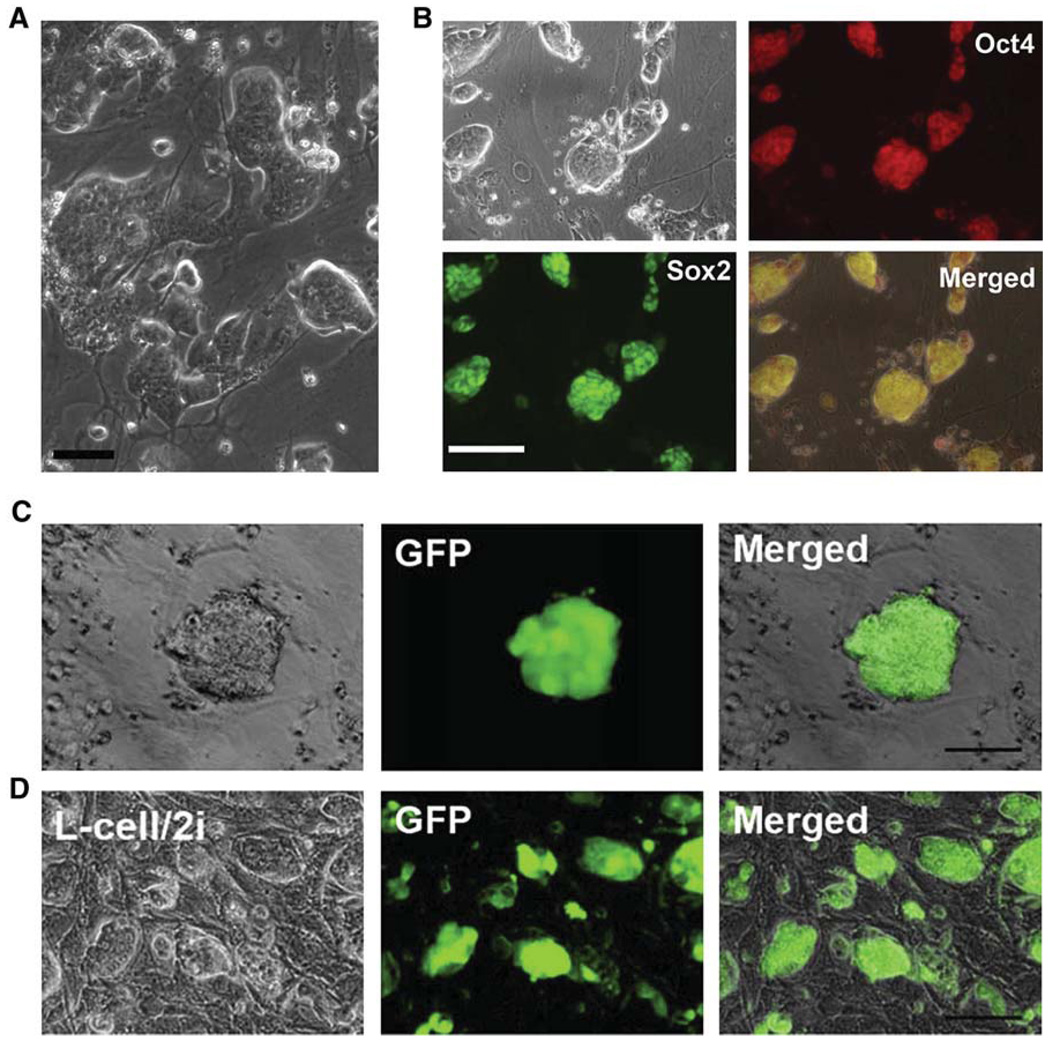
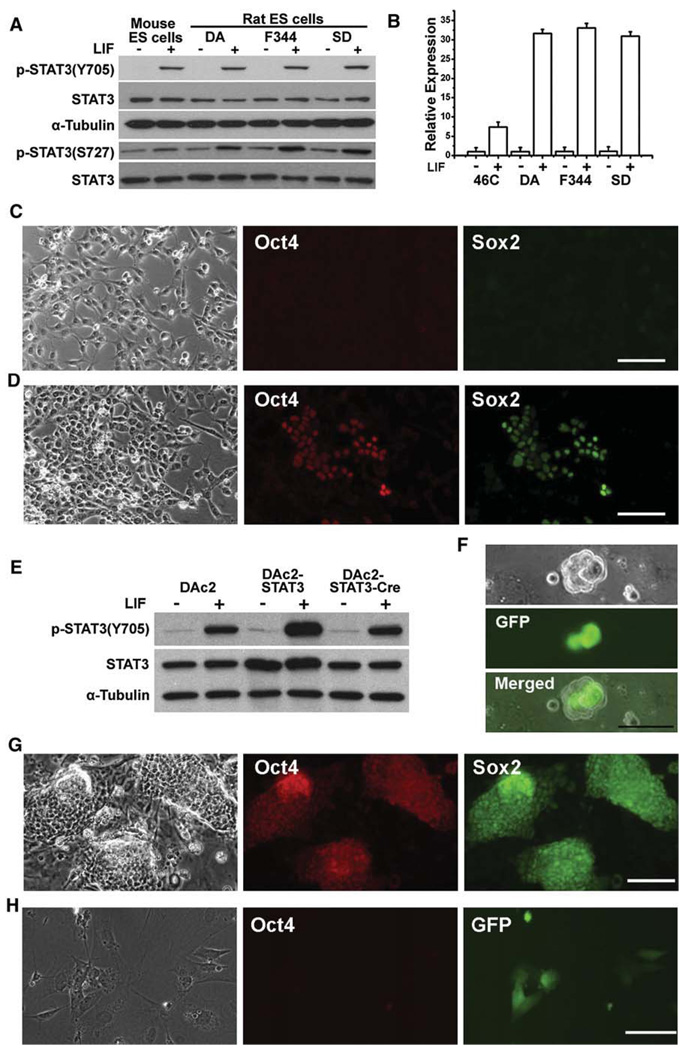
Rats have important advantages over mice as an experimental system for physiological and pharmacological investigations. The lack of rat embryonic stem (ES) cells has restricted the availability of transgenic technologies to create genetic models in this species. Here, we show that rat ES cells can be efficiently derived, propagated, and genetically manipulated in the presence of small molecules that specifically inhibit GSK3, MEK, and FGF receptor tyrosine kinases. These rat ES cells express pluripotency markers and retain the capacity to differentiate into derivatives of all three germ layers. Most importantly, they can produce high rates of chimerism when reintroduced into early stage embryos and can transmit through the germline. Establishment of authentic rat ES cells will make possible sophisticated genetic manipulation to create models for the study of human diseases.


Figures

Figure 1
Figure 1. Rat ES Cells Derived and Maintained in 3i Conditions Express Pluripotency Markers
(A–C) Immunofluorescence staining for Oct4 in the outgrowths of DA rat blastocysts. E4.5 DA rat blastocysts were plated onto mitotically inactivated MEFs with different culture medium: serum-free N2B27 medium supplemented with 3i (A), N2B27 medium only (B), or GMEM/10% FBS supplemented with 10 ng/ml LIF (C). Ten days after plating, the cultures were fixed and stained for Oct4. Scale bars represent 50 µm. (D) Five days after plating, the outgrowths of DA rat blastocysts were disaggregated and replated onto new wells of 4-well plates. This phase contrast image shows colonies of DA rat cells formed from a single outgrowth of blastocyst 4 days after the first disaggregation. The scale bar represents 50 µm. (E) Phase contrast image of DA rat ES cells at passage 25. The scale bar represents 100 µm. (F) Alkaline phosphatase staining of DA rat ES cells at passage 15. The scale bar represents 100 µm. (G–I) Immunofluorescence staining for Oct4 (G), Nanog (H), and Sox2 (I) in DA rat ES cells after 15 passages in 3i conditions. Scale bars represent 50 µm. (J) Western blot analysis of Oct4 expression in mouse and rat ES cells. Rat embryonic fibroblasts (REFs) were used as control. (K) qRT-PCR analysis of Oct4, Nanog, and Sox2 expression in undifferentiated rat ES cells (rES) and REFs. Data were average of triplicate samples and represent relative expression levels of indicated genes in rES and REFs. (L) Expression of cell surface markers in mouse, rat, and human ES cells. Mouse ES cells were grown on gelatin in GMEM/10% FBS medium supplemented with LIF. Rat and human ES cells were maintained in MEF/3i and human ES cell culture conditions, respectively. The scale bar represents 50 µm.
Figure 2
Figure 2. Gene-Specific Histone and DNA Methylation Profiles in Rat ES Cells and REFs
(A and B) The enrichment of H3K4me3 and H3k27me3 at the TSSs of indicated genes was determined by ChIP qPCR in DAc2 rat ES cells (A) and in REFs derived from E14.5 DA rat embryos (B). Data are the average of triplicate qPCR results. (C) Expression levels of indicated genes in rat ES cells (ESC) and REFs were determined by qRT-PCR and were normalized to Gapdh. Data are the average of triplicate samples. (D) Bisulfite sequencing of DNA methylation of the Oct4 and Nanog promoter regions in rat ES cells and REFs. Arrows indicate the transcriptional start sites. Unmethylated and methylated CpGs are shown with open and filled circles, respectively.
Figure 3
Figure 3. In Vitro Differentiation of Rat ES Cells
(A) Phase contrast image of Day 4 EBs formed from DA rat ES cells. The scale bar represents 100 µm. (B) RT-PCR analysis of gene expression in undifferentiated rat ES cells and EBs formed from rat ES cells. (C) Day 4 rat ES cell-derived EBs were plated onto matrigel-coated dishes and cultured in N2B27 medium. Nine days after plating, cells were fixed and stained for neuronal marker βIII-tubulin. The scale bar represents 50 µm. (D) Fourteen days after replating of DA rat ES cell-derived EBs into GMEM medium plus 10% FBS, spontaneously beating areas appeared. The cultures were then fixed and stained for cardiomyocyte marker myosin. (E) GATA4 immunofluorescence staining of differentiated cells derived from DA rat ES cells.
Figure 4
Figure 4. Chimeras and Germline Offspring Produced from Rat ES Cells
(A) Cytogenetic analysis of DAc2 rat ES cells used for the production of germline chimeras. (B) Five chimeras generated by injection of DAc2 rat ES cells into F344 rat blastocysts. The agouti coat color denotes the presence of introduced DA ES cells in albino F344 hosts. Chimera numbers 1, 2, and 3 were female. The other two chimeras were male. F, female; M, male. (C) All three DA/F344 female chimeras mated with SD males have produced pigmented offspring, indicating the transmission of the DA rat ES cell genome. (D) DNA microsatellite analysis of DA rat ES cells, the three germline offspring, and their littermates. M, 100 bp DNA marker; 1, DAc2 rat ES cells; 2, DA rat; 3, F344 rat; 4, SD rat; 5, 7, and 9, the three germline offspring; 6, 8, and 10, their littermates. The PCR primers for different microsatellite markers are listed in Table S5, and the expected sizes of PCR products for different strains of rats are listed in Table S2. (E) The first germline offspring (female) produced by chimera number 1 was mated with an SD male and had produced a litter of nine pups with different coat color patterns. (F) Genotyping analysis of the above nine pups for the agouti gene. The agouti gene (A/A) is present in DA rats, but not in SD rats. Instead, SD rats have a nonagouti gene (a/a) resulting from a loss-of-function mutation of the agouti gene (Kuramoto et al., 2001). The sizes of PCR products for agouti and nonagouti genes are 153 bp and 134 bp, respectively. M, 100bp DNA marker; 1, the agouti/berkshire pup; 2, the agouti/hooded pup; 3, the black/hooded pup; 4–9, the six albino pups.
Figure 5
Figure 5. Propagation and Genetic Manipulation of Rat ES Cells in L Cells/2i Conditions
(A) DAc2 rat ES cells, 4 days after transfer from the MEF/3i condition to the L cell/2i condition. The scale bar represents 25 µm. (B) Immunofluorescence staining for Oct4 and Sox2 in DAc2 rat ES cells after 15 passages in the L cell/2i condition. The scale bar represents 50 µm. (C) One of the GFP-positive DAc2 rat ES cell colonies formed after transfection with GFP plasmids by nucleofection and selection with puromycin in L cell/2i conditions. The scale bar represents 50 µm. (D) DAc2-GFP rat ES cells maintained in L cell/2i conditions for six passages. The scale bar represents 50 µm.
Figure 6
Figure 6. Rat ES Cells Are Responsive to LIF/STAT3 Signaling for Self-Renewal
(A) Analysis of STAT3 activation by western blot in mouse and rat ES cells stimulated with 10 ng/ml LIF for 30 min. (B) qRT-PCR analysis of Socs3 induction by LIF treatment in mouse 46C ES cells and rat ES cells. Data represent mean ± SD of triplicate samples from two independent experiments. (C and D) Immunofluorescence staining for Oct4 and Sox2 in DAc2 rat ES cells 7 days after they were cultured in laminin/N2B27 (C) or laminin/N2B27+LIF (D) conditions. Scale bars represent 50 µm. (E) Western blot analysis of STAT3 activation in DAc2, DAc2-STAT3, and DAc2-STAT3-Cre rat ES cells after treatment with 10 ng/ml LIF for 30 min. (F) DAc2-STAT3 cells, 1 day after transient transfection with Cre to remove the STAT3 transgene and simultaneously activate GFP. The scale bar represents 50 µm. (G) Immunofluorescence staining for Oct4 and Sox2 in DAc2-STAT3 cells after nine passages in L cell/LIF conditions. The scale bar represents 50 µm. (H) Immunofluorescence staining for Oct4 in DAc2-STAT3-Cre cells at second passage in L cell/LIF conditions. The presence of GFP denotes the removal of the STAT3 transgene. The scale bar represents 50 µm.

Similar articles

Cited by

References

    1. Bernstein BE, Mikkelsen TS, Xie X, Kamal M, Huebert DJ, Cuff J, Fry B, Meissner A, Wernig M, Plath K, et al. A bivalent chromatin structure marks key developmental genes in embryonic stem cells. Cell. 2006;125:315–326. - PubMed
    1. Brenin D, Look J, Bader M, Hubner N, Levan G, Iannaccone P. Rat embryonic stem cells: a progress report. Transplant. Proc. 1997;29:1761–1765. - PubMed
    1. Brons IG, Smithers LE, Trotter MW, Rugg-Gunn P, Sun B, Chuva de Sousa Lopes SM, Howlett SK, Clarkson A, Ahrlund-Richter L, Pedersen RA, et al. Derivation of pluripotent epiblast stem cells from mammalian embryos. Nature. 2007;448:191–195. - PubMed
    1. Brook FA, Gardner RL. The origin and efficient derivation of embryonic stem cells in the mouse. Proc. Natl. Acad. Sci. USA. 1997;94:5709–5712. - PMC - PubMed
    1. Buehr M, Nichols J, Stenhouse F, Mountford P, Greenhalgh CJ, Kantachuvesiri S, Brooker G, Mullins J, Smith AG. Rapid loss of Oct-4 and pluripotency in cultured rodent blastocysts and derivative cell lines. Biol. Reprod. 2003;68:222–229. - PubMed

Publication types

Substances