. 2009 Feb;20(4):1241-51.
doi: 10.1091/mbc.e08-06-0659. Epub 2008 Dec 24.

Deficient SUMO attachment to Flp recombinase leads to homologous recombination-dependent hyperamplification of the yeast 2 microm circle plasmid

Affiliations

Deficient SUMO attachment to Flp recombinase leads to homologous recombination-dependent hyperamplification of the yeast 2 microm circle plasmid

Ling Xiong et al. Mol Biol Cell. 2009 Feb.

Abstract

Many Saccharomyces cerevisiae mutants defective in the SUMO pathway accumulate elevated levels of the native 2 microm circle plasmid (2 microm). Here we show that accumulation of 2 microm in the SUMO pathway mutants siz1Delta siz2Delta, slx5Delta, and slx8Delta is associated with formation of an aberrant high-molecular-weight (HMW) form of 2 microm. Characterization of this species from siz1Delta siz2Delta showed that it contains tandem copies of the 2 mum sequence as well as single-stranded DNA. Accumulation of this species requires both the 2 microm-encoded Flp recombinase and the cellular homologous recombination repair (HRR) pathway. Importantly, reduced SUMO attachment to Flp is sufficient to induce formation of this species. Our data suggest a model in which Flp that cannot be sumoylated causes DNA damage, whose repair via HRR produces an intermediate that generates tandem copies of the 2 microm sequence. This intermediate may be a rolling circle formed via break-induced replication (BIR), because mutants defective in BIR contain reduced levels of the HMW form. This work also illustrates the importance of using cir(o) strains when studying mutants that affect the yeast SUMO pathway, to avoid confusing direct functions of the SUMO pathway with secondary effects of 2 microm amplification.


Figures
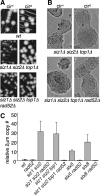
Figure 1.
Figure 1.
Hyperaccumulation of 2 μm requires homologous recombination. (A and B) Strains of the indicated genotypes were grown at 30°C on YPD plates for 2 d (A) or 1 d (B). Note that differences between cir° and cir+ versions of siz1Δ siz2Δ top1Δ in both colony and cell sizes are not seen in siz1Δ siz2Δ top1Δ rad52Δ. (C) 2 μm DNA levels in the indicated strains were analyzed by qPCR. Quantities are expressed relative to wt. Error bars, SD. Three independent cultures were analyzed for each sample.
Figure 2.
Figure 2.
Part of the increase in Rad52 foci in SUMO pathway mutants is due to 2 μm. (A) Cells of the indicated genotype and containing Rad52-GFP were analyzed by fluorescence microscopy. (B) Rad52-GFP foci were counted in cells from triplicate cultures of indicated genotypes. Percent of cells containing 1, 2, or 3+ foci, with SD, is depicted. Statistical significance is given of comparisons between fractions of various cir° strains having one focus, and fractions of cir° and cir+ versions of the same mutant containing ≥2 foci. *p < 0.05; **p < 0.01; calculated using Student's t test. n = 700-1500 cells per strain.
Figure 3.
Figure 3.
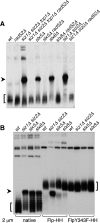
Formation of a HMW 2 μm species in SUMO pathway mutants. (A) Uncut DNA from the indicated strains was analyzed by electrophoresis in an agarose gel containing chloroquine, followed by Southern blotting with a probe against 2 μm. Lanes were normalized to contain equal amounts of 2 μm DNA, as measured by qPCR. Arrowhead indicates the aberrant HMW species. Square bracket indicates supercoiled monomeric 2 μm. (B) DNA from strains of the indicated genotypes containing the indicated versions of 2 μm were analyzed as in A. Both the Flp-Y343F 2 μm variant and the corresponding wt control contained a marker gene, and consequently were larger than native 2 μm. Thus, the supercoiled monomer forms of these plasmids migrated more slowly than native 2 μm, but the HMW form ran at the same position as for native 2 μm.
Figure 4.
Figure 4.
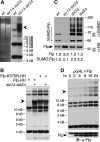
Defects in Flp sumoylation lead to formation of the HMW species. (A) Uncut yeast DNA from the indicated strains was analyzed by EtBr-agarose electrophoresis (left) followed by Southern blotting with a probe against 2 μm (right). Lanes contained equal amounts of 2 μm DNA. An arrowhead indicates the HMW form. (B) Uncut DNA from wt or siz1Δ siz2Δ strains containing the indicated versions of 2 μm was analyzed by Southern blotting as in A. (C) Proteins from indicated strains containing 2 μm expressing Flp(Y343F)-HA-His8 (which does not allow 2 μm amplification) were purified by Ni-NTA affinity chromatography and analyzed by SDS-PAGE and immunoblotting with Abs against SUMO (top) and HA (bottom). Arrowhead indicates unmodified Flp, and an open bracket indicates SUMO-modified Flp. Levels of unmodified Flp as well as ratios of total SUMO signal to unmodified Flp are given below the lanes. Quantities are expressed relative to wt. (D) Flp was expressed from the galactose-inducible GAL1 promoter for the indicated times in log phase wt cells containing native 2 μm. A600 was kept ≤2.0. (top) Uncut DNA was analyzed by Southern blotting as in A, except that lanes contained equal amounts of total DNA rather than equal amounts of 2 μm DNA. (bottom) Whole cell lysates from the same samples as in top panel were analyzed by immunoblotting with an Ab against Flp. Asterisk designates a band that cross-reacts with the Ab.
Figure 5.
Figure 5.
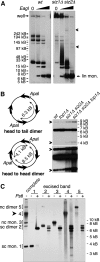
The HMW form contains tandem copies of 2 μm. (A) DNA from indicated strains was left untreated or cleaved with increasing amounts of EagI, as indicated, and analyzed by pulsed-field gel electrophoresis, followed by Southern blotting using a probe against 2 μm. All samples were cleaved to completion with BglII, which does not cleave in 2 μm, to reduce chromosomal DNA to small fragments. wt and siz1Δ siz2Δ panels are from different exposures from the same blot, chosen to normalize the signal from the fully cleaved 2 μm band to the same level, as quantified using the Chemidoc system. The fully cleaved 6.3-kb linear monomer and the position of the well are indicated. Arrowheads designate siz1Δ siz2Δ-specific low-mobility species released by partial restriction digest that may represent nonlinear portions of the HMW species. Markers were NEB MidRange I, which are all indicated, but not all labeled. Major bands in wt uncut sample probably represent the small circular forms of 2 μm, although this has not been shown directly. (B) Left, illustration of head-to-head and head-to-tail dimer linkages and ApaI restriction fragments. Wide arrows denote the 599-base pair internal repeat sequences that contain FRT. Right, DNA from the indicated strains was digested with ApaI and analyzed by Southern blotting with a probe against 2 μm. Bottom, a darker exposure of the top panel. Bands derived from head-to-head dimer linkages are designated with arrows. (C) The five bands indicated on the left were isolated from an EtBr-stained agarose gel and were either analyzed uncut or were digested with PstI, as indicated, followed by Southern analysis as in Figure 4B. Identities of the 2 μm species are indicated. sc, supercoiled; nc, nicked circular; mon., monomer. Arrowhead designates HMW species.
Figure 6.
Figure 6.
The HMW form contains apparent DSBs. (A) Left, diagram of 2 μm monomer showing positions of restriction sites and illustrating the four fragments that would be formed by a PstI digest combined with breaks at FRT. Right, yeast DNA from the indicated strains was digested with indicated restriction enzyme and analyzed by Southern blotting with a probe against 2 μm. All panels are different exposures of the same blot. siz1Δ siz2Δ samples were slightly underloaded relative to wt. Vertical lines indicate bands that are the same between the middle and bottom panels. Open circles indicate bands representing apparent DSBs near FRT. Asterisks indicate bands that result from incomplete digests. (B) Top, diagram of 599-base pair internal repeat (IR) sequence, showing positions of restriction sites, FLP/REP2 gene (transcripts from both genes extend into the same side of the IR), FRT, and probes. Flp generates a single-strand break at one of two sites 8 base pairs apart within FRT, and the XbaI site is between these. Bottom, DNA from indicated strains digested with indicated restriction enzymes was analyzed by Southern blotting using the indicated probes (see Materials and Methods). Duplicate samples were run on the same gel and blotted, and the blot was cut in half and analyzed with different probes. Some samples were treated with Pronase in an attempt to test whether part of the Flp protein was still attached to these DNAs, but no effect was seen. Circles designate bands that represent DSBs in the IR. The band marked with an asterisk does not appear to represent a DSB, because no corresponding small band is present. We do not know what this band is. (C) DNA from indicated strains containing indicated versions of 2 μm were analyzed as in A. Only two DSB bands are visible with AseI; the other two predicted bands are not visible because one is the same size as the head-to-head dimer band, whereas the other is small and is obscured by background. Panels are from the same exposure of the same blot. (D) DNA from the indicated strains was analyzed as in A. Panels are from different exposures of the same blot.
Figure 7.
Figure 7.
Model for formation of 2 μm rolling circle replication intermediate via BIR. (a) Flp (blue) engaged in a covalent intermediate with DNA at FRT is encountered by one or both replication forks (RFs), resulting in (b) a species containing a DSB where one end has Flp covalently linked to the 3′ end, whereas the other 3′ end is free. (c) The HRR pathway catalyzes invasion of the free 3′ end into an intact circular copy of 2 μm, generating a new RF. Depending on the mechanism by which BIR occurs (there are several models), the RF could be followed by a Holliday junction (HJ) (shown) or only the 3′end/leading strand could invade, forming a D loop (not shown). (d) Progression of the RF, accompanied by branch migration of the HJ (shown) or progression of the D loop followed by separate lagging strand synthesis (not shown) would give rise to rolling circle replication. (e) If the RF progressed more rapidly than the HJ, it would replicate the circular template until RF progression is impeded by the HJ. RF progression might then promote branch migration of the HJ. Red lines indicate DNA synthesized by the BIR-derived RF. Curved arrows indicate direction of rotation of rolling circle.
Figure 8.
Figure 8.
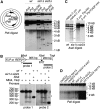
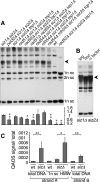
Genes involved in BIR contribute to formation of the HMW species, which contains ssDNA. (A) Top, uncut DNA from the indicated strains was analyzed by Southern blotting with a probe against 2 μm. Lanes were normalized to contain equal quantities of 2 μm DNA. Arrowhead indicates HMW species. Bottom, graph of the ratio of the HMW species to the sum of the two monomeric species plus the supercoiled dimer species. Ratios are relative to siz1Δ siz2Δ. Three independent experiments were averaged, and SD is given. siz1Δ siz2Δ pol32Δ was compared with siz1Δ siz2Δ; other strains to siz1Δ siz2Δ top1Δ. *p < 0.02; **p < 0.01; calculated using Student's t test. (B) Uncut DNA isolated from siz1Δ siz2Δ cells in log phase (log), after 4-h nocodazole treatment (noc) or after 3-h nocodazole treatment followed by 3-h α factor treatment (α factor) was analyzed as in A. (C) Levels of ssDNA in the indicated DNA preparations was measured using QAOS (see Materials and Methods). Ratio of QAOS signal to total DNA at the same locus is given. “sizΔ” is siz1Δ siz2Δ; “1n sc” is isolated supercoiled 2 μm monomer; “HMW” is isolated DNA from the main chromosomal DNA band, which contains the HMW 2 μm species. Three independent DNA preparations were assayed for each sample, except for the isolated supercoiled monomer from wt cells, where two preparations were used. Error bars, SD, except for wt sc monomer where no error is given. *p < 0.05; **p < 0.01; calculated using Student's t test.

Similar articles

Cited by

References

    1. Adkins M. W., Tyler J. K. The histone chaperone Asf1p mediates global chromatin disassembly in vivo. J. Biol. Chem. 2004;279:52069–52074. - PubMed
    1. Ausubel F. M., Brent R., Kingston R. E., Moore D. D., Smith J. A., Seidman J. G., Struhl K. Current Protocols in Molecular Biology. New York: Wiley-Interscience; 2000.
    1. Booth C., Griffith E., Brady G., Lydall D. Quantitative amplification of single-stranded DNA (QAOS) demonstrates that cdc13-1 mutants generate ssDNA in a telomere to centromere direction. Nucleic Acids Res. 2001;29:4414–4422. - PMC - PubMed
    1. Broach J. R., Volkert F. C. Circular DNA plasmids of yeasts. In: Broach J. R., Jones E. W., Pringle J. R., editors. The Molecular and Cellular Biology of the Yeast Saccharomyces. Vol. 1. Plainview, NY: Cold Spring Harbor Press; 1991. pp. 297–331.
    1. Burgess R. C., Rahman S., Lisby M., Rothstein R., Zhao X. The Slx5-Slx8 complex affects sumoylation of DNA repair proteins and negatively regulates recombination. Mol. Cell. Biol. 2007;27:6153–6162. - PMC - PubMed

Publication types

MeSH terms

Substances

LinkOut - more resources