Mucosal immune responses to HIV-1 in elite controllers: a potential correlate of immune control
- PMID: 19109229
- PMCID: PMC2673124
- DOI: 10.1182/blood-2008-10-182709
Mucosal immune responses to HIV-1 in elite controllers: a potential correlate of immune control
Abstract
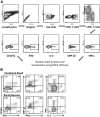
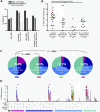
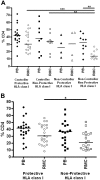
There exists a unique group of persons who are able to durably control HIV in the absence of therapy. The mechanisms of control in these persons remain poorly defined. In this study, we examined CD8(+) T-cell responses in blood and rectal mucosa from 17 "elite controllers" (viral load < 75 copies/mL), 11 "viremic controllers" (75-2000 copies/mL), 14 noncontrollers (> 10,000 copies/mL), and 10 antiretroviral-treated persons (< 75 copies/mL). Production of interferon-gamma, interleukin-2, tumor necrosis factor-alpha, macrophage inflammatory protein-1 beta, and CD107a by CD8(+) T cells in response to HIV-1 Gag stimulation was measured using flow cytometry. Our hypothesis was that "polyfunctional" T cells producing multiple antiviral factors would be most abundant in mucosal tissues of HIV controllers. Mucosal CD8(+) T-cell responses were significantly stronger and more complex in controllers than in antiretroviral-suppressed persons (P = .0004). The frequency of 4-function responses in rectal mucosa was higher in controllers than in noncontrollers and patients on therapy (P < .0001). Mucosal responses in controllers were frequently stronger and more complex than blood responses. These findings demonstrate that many controllers mount strong, complex HIV-specific T-cell responses in rectal mucosa. These responses may play an important role in mucosal immune surveillance, as suggested by their relative enrichment among persons who control HIV in the absence of therapy.
Figures


Similar articles
-
Immunodominant HIV-specific CD8+ T-cell responses are common to blood and gastrointestinal mucosa, and Gag-specific responses dominate in rectal mucosa of HIV controllers.J Virol. 2010 Oct;84(19):10354-65. doi: 10.1128/JVI.00803-10. Epub 2010 Jul 28. J Virol. 2010. PMID: 20668079 Free PMC article.
-
HIV controllers with HLA-DRB1*13 and HLA-DQB1*06 alleles have strong, polyfunctional mucosal CD4+ T-cell responses.J Virol. 2010 Nov;84(21):11020-9. doi: 10.1128/JVI.00980-10. Epub 2010 Aug 18. J Virol. 2010. PMID: 20719952 Free PMC article.
-
HLA class I-restricted T-cell responses may contribute to the control of human immunodeficiency virus infection, but such responses are not always necessary for long-term virus control.J Virol. 2008 Jun;82(11):5398-407. doi: 10.1128/JVI.02176-07. Epub 2008 Mar 19. J Virol. 2008. PMID: 18353945 Free PMC article.
-
Mucosal immunity in HIV controllers: the right place at the right time.Curr Opin HIV AIDS. 2011 May;6(3):202-7. doi: 10.1097/COH.0b013e3283453e2b. Curr Opin HIV AIDS. 2011. PMID: 21399497 Free PMC article. Review.
-
Immune Responses in Controllers of HIV Infection.Annu Rev Immunol. 2024 Jun;42(1):21-33. doi: 10.1146/annurev-immunol-083122-035233. Epub 2024 Jun 14. Annu Rev Immunol. 2024. PMID: 37827174 Review.
Cited by
-
CD8(+) T-cell effector function and transcriptional regulation during HIV pathogenesis.Immunol Rev. 2013 Jul;254(1):190-206. doi: 10.1111/imr.12069. Immunol Rev. 2013. PMID: 23772621 Free PMC article. Review.
-
Early antigen presentation of protective HIV-1 KF11Gag and KK10Gag epitopes from incoming viral particles facilitates rapid recognition of infected cells by specific CD8+ T cells.J Virol. 2013 Mar;87(5):2628-38. doi: 10.1128/JVI.02131-12. Epub 2012 Dec 19. J Virol. 2013. PMID: 23255798 Free PMC article.
-
Differential levels of soluble inflammatory markers by human immunodeficiency virus controller status and demographics.Open Forum Infect Dis. 2015 Jan 13;2(1):ofu117. doi: 10.1093/ofid/ofu117. eCollection 2015 Jan. Open Forum Infect Dis. 2015. PMID: 25884005 Free PMC article.
-
The immunologic effects of maraviroc intensification in treated HIV-infected individuals with incomplete CD4+ T-cell recovery: a randomized trial.Blood. 2013 Jun 6;121(23):4635-46. doi: 10.1182/blood-2012-06-436345. Epub 2013 Apr 15. Blood. 2013. PMID: 23589670 Free PMC article. Clinical Trial.
-
Thirty Years with HIV Infection-Nonprogression Is Still Puzzling: Lessons to Be Learned from Controllers and Long-Term Nonprogressors.AIDS Res Treat. 2012;2012:161584. doi: 10.1155/2012/161584. Epub 2012 May 27. AIDS Res Treat. 2012. PMID: 22693657 Free PMC article.
References
-
- UNAIDS. Vol. 2008. Geneva, Switzerland: UNAIDS; 2007. AIDS epidemic update 2007. In: Joint United Nations Programme on HIV/AIDS.
-
- Deeks SG, Walker BD. Human immunodeficiency virus controllers: mechanisms of durable virus control in the absence of antiretroviral therapy. Immunity. 2007;27:406–416. - PubMed
-
- Ogg GS, Jin X, Bonhoeffer S, et al. Quantitation of HIV-1-specific cytotoxic T lymphocytes and plasma load of viral RNA. Science. 1998;279:2103–2106. - PubMed
Publication types
MeSH terms
Substances
Grants and funding
LinkOut - more resources
Full Text Sources
Other Literature Sources
Medical
Research Materials

