. 2008 Dec 23;6(12):2817-30.
doi: 10.1371/journal.pbio.0060326.

Nutrient-regulated antisense and intragenic RNAs modulate a signal transduction pathway in yeast

Affiliations

Nutrient-regulated antisense and intragenic RNAs modulate a signal transduction pathway in yeast

Masafumi Nishizawa et al. PLoS Biol. .

Abstract

The budding yeast Saccharomyces cerevisiae alters its gene expression profile in response to a change in nutrient availability. The PHO system is a well-studied case in the transcriptional regulation responding to nutritional changes in which a set of genes (PHO genes) is expressed to activate inorganic phosphate (Pi) metabolism for adaptation to Pi starvation. Pi starvation triggers an inhibition of Pho85 kinase, leading to migration of unphosphorylated Pho4 transcriptional activator into the nucleus and enabling expression of PHO genes. When Pi is sufficient, the Pho85 kinase phosphorylates Pho4, thereby excluding it from the nucleus and resulting in repression (i.e., lack of transcription) of PHO genes. The Pho85 kinase has a role in various cellular functions other than regulation of the PHO system in that Pho85 monitors whether environmental conditions are adequate for cell growth and represses inadequate (untimely) responses in these cellular processes. In contrast, Pho4 appears to activate some genes involved in stress response and is required for G1 arrest caused by DNA damage. These facts suggest the antagonistic function of these two players on a more general scale when yeast cells must cope with stress conditions. To explore general involvement of Pho4 in stress response, we tried to identify Pho4-dependent genes by a genome-wide mapping of Pho4 and Rpo21 binding (Rpo21 being the largest subunit of RNA polymerase II) using a yeast tiling array. In the course of this study, we found Pi- and Pho4-regulated intragenic and antisense RNAs that could modulate the Pi signal transduction pathway. Low-Pi signal is transmitted via certain inositol polyphosphate (IP) species (IP7) that are synthesized by Vip1 IP6 kinase. We have shown that Pho4 activates the transcription of antisense and intragenic RNAs in the KCS1 locus to down-regulate the Kcs1 activity, another IP6 kinase, by producing truncated Kcs1 protein via hybrid formation with the KCS1 mRNA and translation of the intragenic RNA, thereby enabling Vip1 to utilize more IP6 to synthesize IP7 functioning in low-Pi signaling. Because Kcs1 also can phosphorylate these IP7 species to synthesize IP8, reduction in Kcs1 activity can ensure accumulation of the IP7 species, leading to further stimulation of low-Pi signaling (i.e., forming a positive feedback loop). We also report that genes apparently not involved in the PHO system are regulated by Pho4 either dependent upon or independent of the Pi conditions, and many of the latter genes are involved in stress response. In S. cerevisiae, a large-scale cDNA analysis and mapping of RNA polymerase II binding using a high-resolution tiling array have identified a large number of antisense RNA species whose functions are yet to be clarified. Here we have shown that nutrient-regulated antisense and intragenic RNAs as well as direct regulation of structural gene transcription function in the response to nutrient availability. Our findings also imply that Pho4 is present in the nucleus even under high-Pi conditions to activate or repress transcription, which challenges our current understanding of Pho4 regulation.


Conflict of interest statement

Competing interests. The authors have declared that no competing interests exist.

Figures

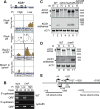
Figure 1
Figure 1. Phosphate Condition-Dependent Pho4 Binding and Pho4-Dependent Expression of Genes
(A) Localization of Pho4 around the PHO8 and PST1 loci. Schematic representations of the regions of these genes (adopted from the results of pattern matching analysis provided by Saccharomyces Genome Database [SGD], http://www.yeastgenome.org/ATContents.shtml) showing prospective Pho4 binding sites (X) are at the top. The next two rows show Pho4 localization to these regions in the wild-type (WT) cells grown under high (H)- or low (L)-phosphate (Pi) conditions analyzed with high- and low-resolution (HR and LR) chips. Localization of Rpo21, the largest subunit of RNA polymerase II, to these regions in the WT or a Δpho4 mutant analyzed with HR chip is shown in the bottom two rows. Yeast cells containing Pho4-Flag × 3 or Rpo21-Flag × 3 were processed for chromatin immunoprecipitation (ChIP) as described in Methods, and enrichment in the immunoprecipitated fraction relative to whole genome DNA is shown in each panel. Blue bars above and below the x-axis represent genes on the Watson and Crick strands, respectively. The y-axis scales are log2(signal ratio) and normalized ratio for HR and LR chips, respectively. In HR chip panels, brown bars represent signals that are judged as significant binding, whereas gray bars are not. The normalized ratio values of the peaks are shown in the LR chip panels. (B) Northern analysis of genes showing Pho4- and Pi-dependent expression. Total RNA was isolated from the wt, Δpho4, or Δpho85 cells grown under high (H)- or low (L)-Pi conditions, subjected to northern blot analysis, and probed with a digoxigenin (DIG)-labeled probe for each gene as designated. (C) Enrichment of promoter regions in the chromatin-immunoprecipitated (ChIPed) DNA fragments dependent on Pi conditions analyzed by gene-specific PCR. Total DNA in the whole cell extract (input) or ChIPed DNA fragments prepared from the wt cells grown under high- or low-Pi conditions were amplified by PCR for 25 or 30 cycles using primer pairs specific to the promoter regions of the genes designated on the left-hand side of the panel. The AIR2 ORF is the negative control for Pho4 binding.
Figure 2
Figure 2. Phosphate-Independent Localization of Pho4 to the Intergenic Region or ORF of Yeast Genes
(A) Localization of Pho4 around the ILV3, ASN1, CIS3, and YPS3 loci. Prospective Pho4 binding sites (X) in each region are shown in the schematic representation of the regions containing these genes at the top. Next two rows show Pho4 localization to these regions in the wild-type (WT) cells grown under high (H)- or low (L)-phosphate (Pi) conditions analyzed with high- and low-resolution (HR and LR) chips. The bottom two rows show Rpo21 localization to these regions analyzed with an HR chip. (B) Northern analysis of genes showing Pi-independent but Pho4-dependent expression, as in the legend to Figure 1B. Pho4 dependency was either positive (ILV3 and ASN1) or negative (CIS3 and YPS3) for expression. ACT1 is the loading control. (C) Enrichment of promoter regions in the ChIPed DNA fragments independent of Pi conditions analyzed by gene-specific PCR. Conditions for PCR are as described in the legend to Figure 1. (D) A schematic representation of the ASN1 promoter showing Pho4 and Gcn4 binding sites (AACGTG and TGACTC, respectively) and activities of the wt and mutant (ASN1mut; lacking Pho4 binding site) promoters represented by β-galactosidase activity. The wt, Δpho85, Δpho4, or Δgcn4 cells harboring respective reporter plasmids were grown to the mid-log phase under high-Pi conditions before the preparation of cell extracts. The values are an average of three different assays, each of which contains measurements with three independent clones.
Figure 3
Figure 3. Pi- and Pho4-Dependent Antisense and Intragenic RNA Species in the KCS1 Locus
(A) The positions of possible Pho4 binding sites within the KCS1 ORF (X) and Pi-dependent localization of Pho4 within the KCS1 ORF detected by HR- and LR-chip analyses are shown in the top two panels. In this case, the results using an HR chip bearing chromosome 3, 4, 5, and 6 sequences are shown for better resolution. Pi- and Pho4-dependent localization of Rpo21 to the KCS1 locus in the wt and Δpho4 strains under high- or low-Pi conditions using the HR chip is shown in the bottom two panels. The slight difference in the data processing programs between the chromosome 3–6 chip and the whole genome chip caused the different appearance of the figures as compared to Figures 1A and 2A. (B) Demonstration of Pi-dependent enrichment of the KCS1 ORF fragment but not the 5′-upstream region by gene-specific PCR. Total DNA in the whole cell extract (input) or ChIPed DNA fragments prepared from the wt or Δpho85 cells grown under high- or low-Pi conditions were subjected to PCR using the primer set specific to the 5′-upstream region or ORF of KCS1 as designated. The conditions for PCR are the same as those described in the legend to Figure 1. (C) Northern analysis of KCS1 sense and AS RNA expression in the wt and various pho mutant strains as designated under high (H)- or low (L)-Pi conditions using strand-specific DIG-RNA probes. For detection of KCS1 sense transcripts, an RNA probe specific to the 3′ region of KCS1 was employed (see Figure 3E). The arrows on the left-hand side of the panel indicate the positions of the KCS1 sense (the top panel) and AS transcripts (the middle panel), respectively. The vertical bar on the left-hand side of the top panel designates short KCS1 sense transcripts ranging from 2,300 to 1,800 nt. The positions of RNA size markers are shown on the right. ACT1 is the loading control. (D) Effect of a Δrrp6 mutation on the levels of the KCS1 sense and AS RNA expression. Total RNA was isolated from the wt or Δrrp6 mutant cells grown under different Pi conditions as described above and subjected to northern analysis using strand-specific DIG-RNA probes as designated. The positions of RNA size markers are shown on the right. ACT1 is the loading control. (E) A schematic representation of the structure of the KCS1 gene showing the positions of the ATG codon at +1 and +676, taking A of the initiating ATG as +1. The blank bar represents the promoter region, and the shaded one is the coding region. The white boxes in the coding region are the prospective Pho4 binding sites at +406, +1127, and +1393. The arrows on the bar designate the major transcription start points of the sense RNA in the 5′-upstream region (at −14) and in the ORF (at +537), and that below the bar is that of the AS RNA (+235), determined by the 5′-RACE method. The boxes below the bar indicate the positions of the strand-specific probes used for northern analysis: the blank box is a sense-strand-specific probe (+3150 to +1875), and the black one is the AS strand (−715 to +295).
Figure 4
Figure 4. Requirement of Pho4 Binding Sites for the Expression of the KCS1 Intragenic and AS RNAs and for the Production of the Truncated Kcs1 Protein
(A) Expression of the KCS1 sense and AS RNAs from the wt or mutant (Mut; lacking the three Pho4 binding sites) KCS1 gene in a YCp plasmid in Δkcs1 or Δkcs1 Δpho85 strain under high (H)- or low (L)-Pi conditions was analyzed by northern blotting with strand-specific RNA probes. Positions of the KCS1 sense (top panel) and AS RNA (second panel from the top) are designated by arrows and a vertical bar on the left-hand side of the panels. The positions of RNA size markers (nt) are on the right. ACT1 is the loading control. The Kcs1 protein tagged with the c-myc epitope at its C terminus was detected by western blotting using anti-myc antibody. The full-length and truncated Kcs1 proteins are designated by two arrows on the left-hand side of the second panel from the bottom. The positions of marker proteins are on the right. Actin is the loading control for western analysis. The faint band between 83 and 62 kDa markers observed in all lanes is nonspecific staining of yeast protein by the anti-myc antibody. (B) Heterologous KCS1 AS RNA expression and production of the truncated Kcs1 protein. A Δkcs1 strain harboring KCS1mut-myc in a YCp vector and pGAL1-AS RNA in a YEp vector or vector alone was analyzed for KCS1 sense and AS RNA expression by northern blotting as designated. AS RNA expression was induced by incubating the transformants in galactose medium for 6 h (Gal) or repressed in glucose medium (Glc). Production of Kcs1-myc protein was detected as described above. (C) An RNA hybrid formation of the KCS1 mRNA with the AS RNA detected by RNase protection assay and RT-PCR. A schematic representation of the KCS1 gene of interest is shown at the top. The arrows on the bar designate the major transcription start points of the mRNA (at −14) and of the AS RNA (+235). The boxes below the bar indicate the positions of the strand-specific primers used for the detection of dsRNA: the blank boxes are sense-strand-specific primers (sense, +243 to +223, and sense*, +415 to +395), and the black ones are primers for the AS strand (AS, −16 to +5, and AS*, −68 to −48). Total RNA was isolated from the wt, Δpho85, Δkcs1, Δkcs1 harboring KCS1mut, or Δkcs1 expressing the AS RNA under the TDH3 promoter, grown in high-Pi medium, except that Δkcs1 harboring KCS1mut was in low-Pi medium. About 10 μg of each RNA sample was incubated with (+) or without (–) RNase ONE. For negative control (–RNA), total RNA was replaced by yeast tRNA. The digestion products were then used as templates for first-strand cDNA synthesis with strand-specific primers as designated, and the cDNA products were subjected to PCR amplification with the appropriate reverse primer. The sense-strand-specific (sense) primer, from +243 to +223; antisense-strand-specific (AS), from −16 to +5; sense*, from +415 to +395; and AS*, from −68 to −48. For lanes 14, 16, 18, 20, 23, and 26, one-tenth of the amount of the cDNA template was used for PCR compared to those in the other lanes. The PCR products were analyzed by electrophoresis on a 5% polyacrylamide gel, and 10-fold dilutions of the PCR products were loaded in lanes 16, 20, 23, and 26. The positions of DNA size markers are shown on the right-hand side of each panel. (D) Pho4-directed and Pi-dependent transcription within the KCS1 ORF. The N-terminally truncated wt or mutant (Mut) KCS1 ORF (+105 to +3150) placed in a YCp plasmid was introduced into Δkcs1 or Δkcs1 Δpho4 strain, and transcription of sense RNA under high (H)- or low (L)-Pi conditions was detected by northern blotting using a strand-specific probe (top panel). The positions of RNA size markers are shown on the right and ACT1 is the loading control. (E) The intragenic RNA also can encode the truncated Kcs1-myc protein. The truncated wt or Mut KCS1 ORF (+105 to +3150) tagged with c-myc at its C terminus was introduced into the Δkcs1 strain, and the production of Kcs1-myc protein was analyzed by western blotting. WT* designates the full-length wt KCS1 gene tagged with c-myc, which produced the normal and truncated Kcs1-myc protein (lane 39) as in lane 5 of Figure 4A. Actin is the loading control for western analysis.
Figure 5
Figure 5. Effect of KCS1 and VIP1 on PHO84 and PHO5 Expression Analyzed by Northern Blotting
The wt, various mutants, or those harboring plasmids expressing KCS1, KCS1mut, AS RNA, or a truncated Kcs1 protein (dKcs1) were incubated for 5 h in high (H)- or low (L)-Pi media before isolation of total RNA as described in Methods. ACT1 is the loading control.

Similar articles

Cited by

References

    1. Carroll AS, O'Shea EK. Pho85 and signaling environmental conditions. Trends Biochem Sci. 2002;27:87–93. - PubMed
    1. Wilson WA, Roach PJ. Nutrient-regulated protein kinases in budding yeast. Cell. 2002;111:155–158. - PubMed
    1. Oshima Y. The phosphate system in Saccharomyces cerevisiae . Genes Genet Syst. 1997;72:323–334. - PubMed
    1. Kaffman A, Rank N, O'Shea E. Phosphorylation regulates association of the transcription factor Pho4 with its import receptor Pse1/Kap121. Genes Dev. 1998a;12:2673–2683. - PMC - PubMed
    1. Kaffman A, Rank NM, O'Neill EM, Huang LS, O'Shea EK. The receptor Msn5 exports the phosphorylated transcription factor Pho4 out of the nucleus. Nature. 1998b;396:482–486. - PubMed

Publication types

MeSH terms