Hardwiring of fine synaptic layers in the zebrafish visual pathway
- PMID: 19087349
- PMCID: PMC2647910
- DOI: 10.1186/1749-8104-3-36
Hardwiring of fine synaptic layers in the zebrafish visual pathway
Abstract
Background: Neuronal connections are often arranged in layers, which are divided into sublaminae harboring synapses with similar response properties. It is still debated how fine-grained synaptic layering is established during development. Here we investigated two stratified areas of the zebrafish visual pathway, the inner plexiform layer (IPL) of the retina and the neuropil of the optic tectum, and determined if activity is required for their organization.
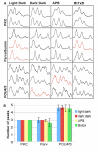
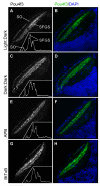
Results: The IPL of 5-day-old zebrafish larvae is composed of at least nine sublaminae, comprising the connections between different types of amacrine, bipolar, and ganglion cells (ACs, BCs, GCs). These sublaminae were distinguished by their expression of cell type-specific transgenic fluorescent reporters and immunohistochemical markers, including protein kinase Cbeta (PKC), parvalbumin (Parv), zrf3, and choline acetyltransferase (ChAT). In the tectum, four retinal input layers abut a laminated array of neurites of tectal cells, which differentially express PKC and Parv. We investigated whether these patterns were affected by experimental disruptions of retinal activity in developing fish. Neither elimination of light inputs by dark rearing, nor a D, L-amino-phosphono-butyrate-induced reduction in the retinal response to light onset (but not offset) altered IPL or tectal lamination. Moreover, thorough elimination of chemical synaptic transmission with Botulinum toxin B left laminar synaptic arrays intact.
Conclusion: Our results call into question a role for activity-dependent mechanisms - instructive light signals, balanced on and off BC activity, Hebbian plasticity, or a permissive role for synaptic transmission - in the synaptic stratification we examined. We propose that genetically encoded cues are sufficient to target groups of neurites to synaptic layers in this vertebrate visual system.
Figures


Similar articles
-
Assembly of synaptic laminae by axon guidance molecules.Curr Opin Neurobiol. 2012 Oct;22(5):799-804. doi: 10.1016/j.conb.2012.04.014. Epub 2012 May 23. Curr Opin Neurobiol. 2012. PMID: 22632825 Review.
-
Targeting of amacrine cell neurites to appropriate synaptic laminae in the developing zebrafish retina.Development. 2005 Nov;132(22):5069-79. doi: 10.1242/dev.02075. Development. 2005. PMID: 16258076
-
Transmembrane semaphorin signalling controls laminar stratification in the mammalian retina.Nature. 2011 Feb 10;470(7333):259-63. doi: 10.1038/nature09675. Nature. 2011. PMID: 21270798 Free PMC article.
-
Histochemical localization of cytochrome oxidase in the retina and optic tectum of normal goldfish: a combined cytochrome oxidase-horseradish peroxidase study.J Comp Neurol. 1988 Apr 15;270(3):354-71. doi: 10.1002/cne.902700305. J Comp Neurol. 1988. PMID: 2836476
-
Development of On and Off retinal pathways and retinogeniculate projections.Prog Retin Eye Res. 2004 Jan;23(1):31-51. doi: 10.1016/j.preteyeres.2003.10.001. Prog Retin Eye Res. 2004. PMID: 14766316 Review.
Cited by
-
Valproic acid affects neurogenesis during early optic tectum development in zebrafish.Biol Open. 2023 Jan 15;12(1):bio059567. doi: 10.1242/bio.059567. Epub 2023 Jan 31. Biol Open. 2023. PMID: 36537579 Free PMC article.
-
Single-Cell Reconstruction of Oxytocinergic Neurons Reveals Separate Hypophysiotropic and Encephalotropic Subtypes in Larval Zebrafish.eNeuro. 2017 Feb 8;4(1):ENEURO.0278-16.2016. doi: 10.1523/ENEURO.0278-16.2016. eCollection 2017 Jan-Feb. eNeuro. 2017. PMID: 28317020 Free PMC article.
-
Direction selectivity in the visual system of the zebrafish larva.Front Neural Circuits. 2013 Jun 18;7:111. doi: 10.3389/fncir.2013.00111. eCollection 2013. Front Neural Circuits. 2013. PMID: 23785314 Free PMC article. Review.
-
Computational processing of optical measurements of neuronal and synaptic activity in networks.J Neurosci Methods. 2010 Apr 30;188(1):141-50. doi: 10.1016/j.jneumeth.2010.01.033. Epub 2010 Feb 10. J Neurosci Methods. 2010. PMID: 20152860 Free PMC article.
-
Molecular mechanisms of synaptic specificity in developing neural circuits.Neuron. 2010 Oct 6;68(1):9-18. doi: 10.1016/j.neuron.2010.09.007. Neuron. 2010. PMID: 20920787 Free PMC article. Review.
References
-
- Hahm JO, Cramer KS, Sur M. Pattern formation by retinal afferents in the ferret lateral geniculate nucleus: developmental segregation and the role of N-methyl-D-aspartate receptors. J Comp Neurol. 1999;411:327–345. doi: 10.1002/(SICI)1096-9861(19990823)411:2<327::AID-CNE12>3.0.CO;2-#. - DOI - PubMed
MeSH terms
Substances
LinkOut - more resources
Full Text Sources
Molecular Biology Databases
Miscellaneous

