Imaging and quantifying the dynamics of tumor-associated proteolysis
- PMID: 19082919
- PMCID: PMC2991638
- DOI: 10.1007/s10585-008-9218-7
Imaging and quantifying the dynamics of tumor-associated proteolysis
Abstract
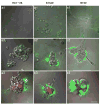
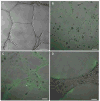
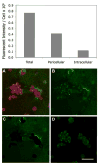
The roles of proteases in cancer are dynamic. Furthermore, the roles or functions of any one protease may differ from one stage of cancer to another. Proteases from tumor-associated cells (e.g., fibroblasts, inflammatory cells, endothelial cells) as well as from tumor cells make important contributions to 'tumor proteolysis'. Many tumors exhibit increases in expression of proteases at the level of transcripts and protein; however, whether those proteases play causal roles in malignant progression is known for only a handful of proteases. What the critical substrate or substrates that are cleaved in vivo by any given protease is also known for only a few proteases. Therefore, the recent development of techniques and reagents for live cell imaging of protease activity, in conjunction with informed knowledge of critical natural substrates, should help to define protease functions. Here we describe live cell assays for imaging proteolysis, protocols for quantifying proteolysis and the use of such assays to follow the dynamics of proteolysis by tumor cells alone and tumor cells interacting with other cells found in the tumor microenvironment. In addition, we describe an in vitro model that recapitulates the architecture of the mammary gland, a model designed to determine the effects of dynamic interactions with the surrounding microenvironment on 'tumor proteolysis' and the respective contributions of various cell types to 'tumor proteolysis'. The assays and models described here could serve as screening platforms for the identification of proteolytic pathways that are potential therapeutic targets and for further development of technologies and imaging probes for in vivo use.
Figures


Similar articles
-
Functional imaging of tumor proteolysis.Annu Rev Pharmacol Toxicol. 2006;46:301-15. doi: 10.1146/annurev.pharmtox.45.120403.095853. Annu Rev Pharmacol Toxicol. 2006. PMID: 16402907 Review.
-
Pathomimetic cancer avatars for live-cell imaging of protease activity.Biochimie. 2016 Mar;122:68-76. doi: 10.1016/j.biochi.2015.09.015. Epub 2015 Sep 12. Biochimie. 2016. PMID: 26375517 Free PMC article. Review.
-
Extracellular proteolysis in cancer: Proteases, substrates, and mechanisms in tumor progression and metastasis.J Biol Chem. 2024 Jun;300(6):107347. doi: 10.1016/j.jbc.2024.107347. Epub 2024 May 6. J Biol Chem. 2024. PMID: 38718867 Free PMC article. Review.
-
The Tumor Proteolytic Landscape: A Challenging Frontier in Cancer Diagnosis and Therapy.Int J Mol Sci. 2021 Mar 3;22(5):2514. doi: 10.3390/ijms22052514. Int J Mol Sci. 2021. PMID: 33802262 Free PMC article. Review.
-
Live-Cell Imaging of Protease Activity: Assays to Screen Therapeutic Approaches.Methods Mol Biol. 2017;1574:215-225. doi: 10.1007/978-1-4939-6850-3_16. Methods Mol Biol. 2017. PMID: 28315254 Free PMC article.
Cited by
-
RNA-Seq of human breast ductal carcinoma in situ models reveals aldehyde dehydrogenase isoform 5A1 as a novel potential target.PLoS One. 2012;7(12):e50249. doi: 10.1371/journal.pone.0050249. Epub 2012 Dec 6. PLoS One. 2012. PMID: 23236365 Free PMC article.
-
Cell type-dependent pathogenic functions of overexpressed human cathepsin B in murine breast cancer progression.Oncogene. 2014 Sep 4;33(36):4474-84. doi: 10.1038/onc.2013.395. Epub 2013 Sep 30. Oncogene. 2014. PMID: 24077280 Free PMC article.
-
Development of 3D culture models of plexiform neurofibroma and initial application for phenotypic characterization and drug screening.Exp Neurol. 2018 Jan;299(Pt B):289-298. doi: 10.1016/j.expneurol.2017.10.012. Epub 2017 Oct 19. Exp Neurol. 2018. PMID: 29055717 Free PMC article.
-
Cathepsin B inhibition limits bone metastasis in breast cancer.Cancer Res. 2012 Mar 1;72(5):1199-209. doi: 10.1158/0008-5472.CAN-11-2759. Epub 2012 Jan 19. Cancer Res. 2012. PMID: 22266111 Free PMC article.
-
Strategies for the discovery and development of therapies for metastatic breast cancer.Nat Rev Drug Discov. 2012 Jun 1;11(6):479-97. doi: 10.1038/nrd2372. Nat Rev Drug Discov. 2012. PMID: 22653217 Review.
References
-
- Edwards DR, Hoyer-Hansen G, Blasi F, Sloane BF, editors. The cancer degradome—proteases and cancer biology. Springer; New York: 2008.
-
- Kataoka H, Tanaka H, Nagaike K, Uchiyama S, Itoh H. Role of cancer cell-stroma interaction in invasive growth of cancer cells. Hum Cell. 2003;16:1–14. - PubMed
Publication types
MeSH terms
Substances
Grants and funding
LinkOut - more resources
Full Text Sources
Other Literature Sources
Medical

