Role of hypoxia in obesity-induced disorders of glucose and lipid metabolism in adipose tissue
- PMID: 19066318
- PMCID: PMC2645021
- DOI: 10.1152/ajpendo.90760.2008
Role of hypoxia in obesity-induced disorders of glucose and lipid metabolism in adipose tissue
Abstract
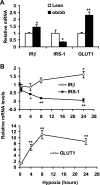
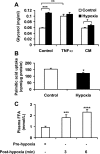
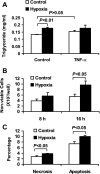
Recent studies suggest that adipose tissue hypoxia (ATH) may contribute to endocrine dysfunction in adipose tissue of obese mice. In this study, we examined hypoxia's effects on metabolism in adipocytes. We determined the dynamic relationship of ATH and adiposity in ob/ob mice. The interstitial oxygen pressure (Po(2)) was monitored in the epididymal fat pads for ATH. During weight gain from 39.5 to 55.5 g, Po(2) declined from 34.8 to 20.1 mmHg, which are 40-60% lower than those in the lean mice. Insulin receptor-beta (IRbeta) and insulin receptor substrate-1 (IRS-1) were decreased in the adipose tissue of obese mice, and the alteration was observed in 3T3-L1 adipocytes after hypoxia (1% oxygen) treatment. Insulin-induced glucose uptake and Akt Ser(473) phosphorylation was blocked by hypoxia in the adipocytes. This effect of hypoxia exhibited cell type specificity, as it was not observed in L6 myotubes and betaTC6 cells. In response to hypoxia, free fatty acid (FFA) uptake was reduced and lipolysis was increased in 3T3-L1 adipocytes. The molecular mechanism of decreased fatty acid uptake may be related to inhibition of fatty acid transporters (FATP1 and CD36) and transcription factors (PPARgamma and C/EBPalpha) by hypoxia. The hypoxia-induced lipolysis was observed in vivo after femoral arterial clamp. Necrosis and apoptosis were induced by hypoxia in 3T3-L1 adipocytes. These data suggest that ATH may promote FFA release and inhibit glucose uptake in adipocytes by inhibition of the insulin-signaling pathway and induction of cell death.
Figures


Similar articles
-
Hypoxia is a potential risk factor for chronic inflammation and adiponectin reduction in adipose tissue of ob/ob and dietary obese mice.Am J Physiol Endocrinol Metab. 2007 Oct;293(4):E1118-28. doi: 10.1152/ajpendo.00435.2007. Epub 2007 Jul 31. Am J Physiol Endocrinol Metab. 2007. PMID: 17666485
-
Ginsenoside Rb2 promotes glucose metabolism and attenuates fat accumulation via AKT-dependent mechanisms.Biomed Pharmacother. 2018 Apr;100:93-100. doi: 10.1016/j.biopha.2018.01.111. Epub 2018 Feb 6. Biomed Pharmacother. 2018. PMID: 29425748
-
Zinc transporter 7 deficiency affects lipid synthesis in adipocytes by inhibiting insulin-dependent Akt activation and glucose uptake.FEBS J. 2016 Jan;283(2):378-94. doi: 10.1111/febs.13582. Epub 2015 Dec 12. FEBS J. 2016. PMID: 26524605
-
Adipose tissue oxygen tension: implications for chronic metabolic and inflammatory diseases.Curr Opin Clin Nutr Metab Care. 2012 Nov;15(6):539-46. doi: 10.1097/MCO.0b013e328358fa87. Curr Opin Clin Nutr Metab Care. 2012. PMID: 23037900 Review.
-
Multihormonal control of ob gene expression and leptin secretion from cultured human visceral adipose tissue: increased responsiveness to glucocorticoids in obesity.J Clin Endocrinol Metab. 1998 Mar;83(3):902-10. doi: 10.1210/jcem.83.3.4644. J Clin Endocrinol Metab. 1998. PMID: 9506746 Review.
Cited by
-
Of mice and men: Considerations on adipose tissue physiology in animal models of obesity and human studies.Metabol Open. 2022 Aug 24;15:100208. doi: 10.1016/j.metop.2022.100208. eCollection 2022 Sep. Metabol Open. 2022. PMID: 36092796 Free PMC article.
-
The impact of hypoxia exposure on glucose homeostasis in metabolically compromised humans: A systematic review.Rev Endocr Metab Disord. 2021 Jun;22(2):471-483. doi: 10.1007/s11154-021-09654-0. Epub 2021 Apr 14. Rev Endocr Metab Disord. 2021. PMID: 33851320 Free PMC article. Review.
-
Sirtuins-Mediated System-Level Regulation of Mammalian Tissues at the Interface between Metabolism and Cell Cycle: A Systematic Review.Biology (Basel). 2021 Mar 4;10(3):194. doi: 10.3390/biology10030194. Biology (Basel). 2021. PMID: 33806509 Free PMC article. Review.
-
OSAS-related inflammatory mechanisms of liver injury in nonalcoholic fatty liver disease.Mediators Inflamm. 2015;2015:815721. doi: 10.1155/2015/815721. Epub 2015 Mar 19. Mediators Inflamm. 2015. PMID: 25873773 Free PMC article. Review.
-
Effects of hyperoxia exposure on metabolic markers and gene expression in 3T3-L1 adipocytes.J Physiol Biochem. 2012 Dec;68(4):663-9. doi: 10.1007/s13105-012-0169-8. Epub 2012 Apr 26. J Physiol Biochem. 2012. PMID: 22535284
References
-
- Bano KA, Batool A. Metabolic syndrome, cardiovascular disease and type-2 diabetes. J Pak Med Assoc 57: 511–515, 2007. - PubMed
-
- Bashan N, Burdett E, Hundal HS, Klip A. Regulation of glucose transport and GLUT1 glucose transporter expression by O2 in muscle cells in culture. Am J Physiol Cell Physiol 262: C682–C690, 1992. - PubMed
-
- Bastard JP, Maachi M, Lagathu C, Kim MJ, Caron M, Vidal H, Capeau J, Feve B. Recent advances in the relationship between obesity, inflammation, and insulin resistance. Eur Cytokine Netw 17: 4–12, 2006. - PubMed
-
- Boden G Role of fatty acids in the pathogenesis of insulin resistance and NIDDM. Diabetes 46: 3–10, 1997. - PubMed
Publication types
MeSH terms
Substances
Grants and funding
LinkOut - more resources
Full Text Sources
Medical
Molecular Biology Databases
Miscellaneous

