

Toll-like receptor and innate cytokine responses induced by lactobacilli colonization and human rotavirus infection in gnotobiotic pigs
- PMID: 19054578
- PMCID: PMC2653198
- DOI: 10.1016/j.vetimm.2008.10.322
Toll-like receptor and innate cytokine responses induced by lactobacilli colonization and human rotavirus infection in gnotobiotic pigs
Abstract
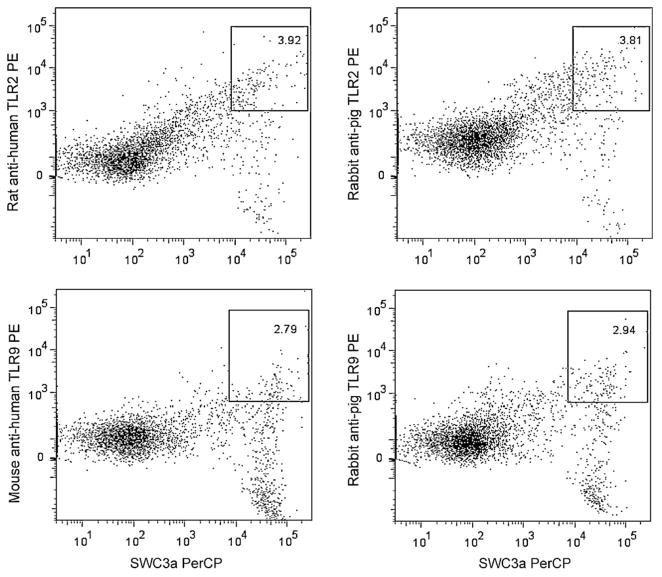
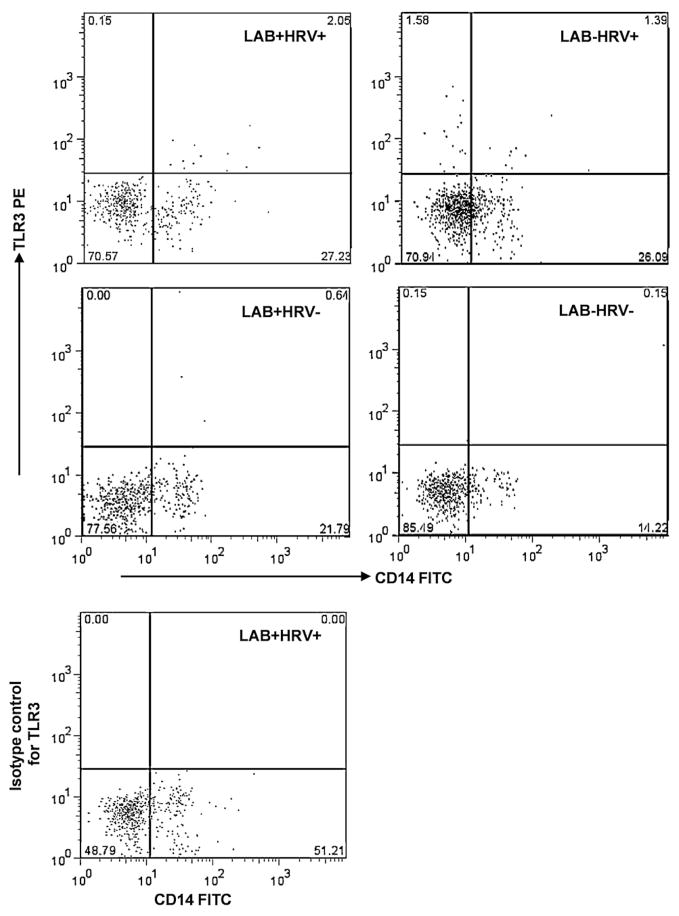
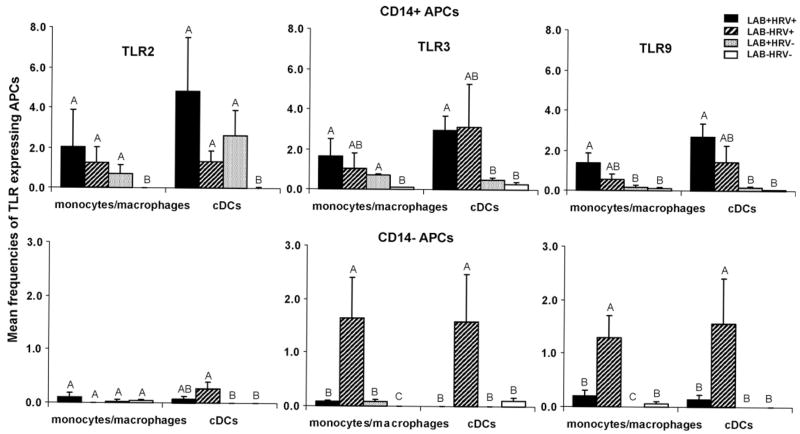
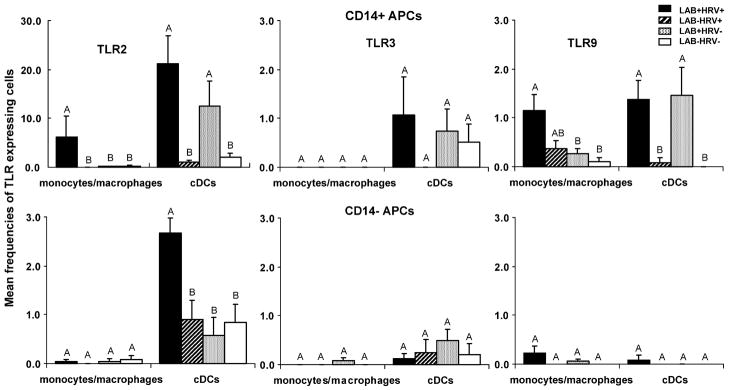
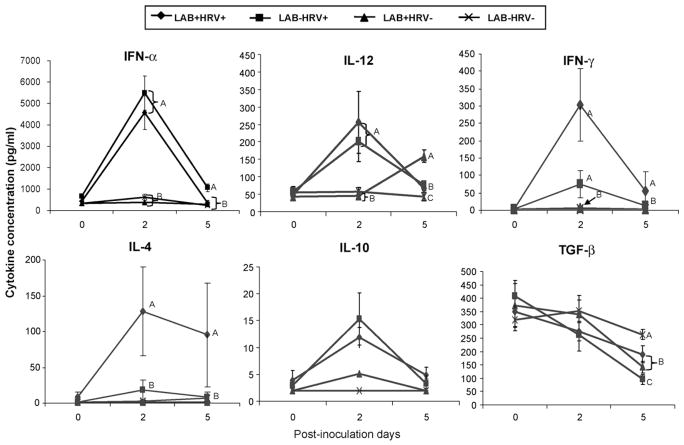
Toll-like receptors (TLR) play an important role in the recognition of microbes by host sentinel cells that leads to the subsequent innate and adaptive immune responses. In this study, we evaluated the patterns of TLR2-, TLR3- and TLR9-expressing antigen presenting cells (APCs) in spleen and blood of gnotobiotic (Gn) pigs after colonization with a mixture of two strains of lactic acid bacteria (LAB), Lactobacillus acidophilus and Lactobacillus reuteri or infection with the virulent human rotavirus (HRV) Wa strain. We also assessed the influence of LAB on TLR and serum innate cytokine responses induced by HRV. Distributions of subpopulations of APCs [CD14+/-SWC3+CD11R1- monocytes/macrophages and CD14+/-SWC3+CD11R1+ conventional dendritic cells (cDCs)] were described in our previous report (Zhang, W., Wen, K., Azevedo, M.S., Gonzalez, A.M., Saif, L.J., Li, G., Yousef, A.E., Yuan, L., 2008. Lactic acid bacterial colonization and human rotavirus infection influence distribution and frequencies of monocytes/macrophages and dendritic cells in neonatal gnotobiotic pigs. Vet. Immunol. Immunopathol. 121, pp. 222-231). We demonstrated that LAB induced strong TLR2-expressing APC responses in blood and spleen, HRV induced a TLR3 response in spleen, and TLR9 responses were induced by either HRV (in spleen) or LAB (in blood). LAB and HRV have an additive effect on TLR2- and TLR9-expressing APC responses, consistent with the adjuvant effect of LAB. Overall, the frequencies of TLR-expressing CD14+ APCs were higher than CD14- APCs. LAB enhanced the IFN-gamma and IL-4 responses in serum, but it had a suppressive effect on the TLR3- and TLR9-expressing CD14- APC responses in spleen and the serum IFN-alpha response induced by HRV. These results elucidated the systemic TLR2-, TLR3-, and TLR9-expressing monocyte/macrophage and cDC responses after HRV infection, LAB colonization, and the two combined. Our findings facilitate the understanding of the mechanism of LAB's adjuvant effect on rotavirus vaccines and the diverse innate and adaptive immune responses induced by commensal LAB colonization versus rotavirus infection and the interactions between them.
Figures
Similar articles
-
Lactobacilli and bifidobacteria promote immune homeostasis by modulating innate immune responses to human rotavirus in neonatal gnotobiotic pigs.PLoS One. 2013 Oct 2;8(10):e76962. doi: 10.1371/journal.pone.0076962. eCollection 2013. PLoS One. 2013. PMID: 24098572 Free PMC article.
-
Lactic acid bacterial colonization and human rotavirus infection influence distribution and frequencies of monocytes/macrophages and dendritic cells in neonatal gnotobiotic pigs.Vet Immunol Immunopathol. 2008 Feb 15;121(3-4):222-31. doi: 10.1016/j.vetimm.2007.10.001. Epub 2007 Oct 10. Vet Immunol Immunopathol. 2008. PMID: 18006076 Free PMC article.
-
Lactobacillus acidophilus and Lactobacillus reuteri modulate cytokine responses in gnotobiotic pigs infected with human rotavirus.Benef Microbes. 2012 Mar 1;3(1):33-42. doi: 10.3920/BM2011.0041. Benef Microbes. 2012. PMID: 22348907 Free PMC article.
-
Influence of probiotic Lactobacilli colonization on neonatal B cell responses in a gnotobiotic pig model of human rotavirus infection and disease.Vet Immunol Immunopathol. 2008 Mar 15;122(1-2):175-81. doi: 10.1016/j.vetimm.2007.10.003. Epub 2007 Oct 10. Vet Immunol Immunopathol. 2008. PMID: 18023882 Free PMC article.
-
Toll-like receptors as adjuvant receptors.Biochim Biophys Acta. 2002 Feb 13;1589(1):1-13. doi: 10.1016/s0167-4889(01)00182-3. Biochim Biophys Acta. 2002. PMID: 11909637 Review.
Cited by
-
The Effects of Dietary Bacillus amyloliquefaciens TL106 Supplementation, as an Alternative to Antibiotics, on Growth Performance, Intestinal Immunity, Epithelial Barrier Integrity, and Intestinal Microbiota in Broilers.Animals (Basel). 2022 Nov 9;12(22):3085. doi: 10.3390/ani12223085. Animals (Basel). 2022. PMID: 36428313 Free PMC article.
-
Modulatory effects of Lactobacillus salivarius on intestinal mucosal immunity of piglets.Curr Microbiol. 2011 May;62(5):1623-31. doi: 10.1007/s00284-011-9906-4. Epub 2011 Mar 2. Curr Microbiol. 2011. PMID: 21365445
-
Lactobacilli and bifidobacteria promote immune homeostasis by modulating innate immune responses to human rotavirus in neonatal gnotobiotic pigs.PLoS One. 2013 Oct 2;8(10):e76962. doi: 10.1371/journal.pone.0076962. eCollection 2013. PLoS One. 2013. PMID: 24098572 Free PMC article.
-
Development of γδ T cell subset responses in gnotobiotic pigs infected with human rotaviruses and colonized with probiotic lactobacilli.Vet Immunol Immunopathol. 2011 Jun 15;141(3-4):267-75. doi: 10.1016/j.vetimm.2011.03.016. Epub 2011 Mar 23. Vet Immunol Immunopathol. 2011. PMID: 21489639 Free PMC article. Clinical Trial.
-
Immunobiotic Lactobacillus jensenii modulates the Toll-like receptor 4-induced inflammatory response via negative regulation in porcine antigen-presenting cells.Clin Vaccine Immunol. 2012 Jul;19(7):1038-53. doi: 10.1128/CVI.00199-12. Epub 2012 May 9. Clin Vaccine Immunol. 2012. PMID: 22573738 Free PMC article.
References
-
- Aich P, Wilson HL, Kaushik RS, Potter AA, Babiuk LA, Griebel P. Comparative analysis of innate immune responses following infection of newborn calves with bovine rotavirus and bovine coronavirus. J Gen Virol. 2007;88:2749–2761. - PubMed
-
- Akira S, Takeda K. Toll-like receptor signalling. Nat Rev Immunol. 2004;4:499–511. - PubMed
-
- Altermann E, Russell WM, Azcarate-Peril MA, Barrangou R, Buck BL, McAuliffe O, Souther N, Dobson A, Duong T, Callanan M, Lick S, Hamrick A, Cano R, Klaenhammer TR. Complete genome sequence of the probiotic lactic acid bacterium Lactobacillus acidophilus NCFM. Proc Natl Acad Sci USA. 2005;102:3906–3912. - PMC - PubMed
Publication types
MeSH terms
Substances
Grants and funding
LinkOut - more resources
Full Text Sources
Medical
Research Materials
Miscellaneous
