. 2009 Feb;108(3):644-61.
doi: 10.1111/j.1471-4159.2008.05787.x. Epub 2008 Nov 17.

Reactive oxygen species regulate F-actin dynamics in neuronal growth cones and neurite outgrowth

Affiliations

Reactive oxygen species regulate F-actin dynamics in neuronal growth cones and neurite outgrowth

Vidhya Munnamalai et al. J Neurochem. 2009 Feb.

Abstract

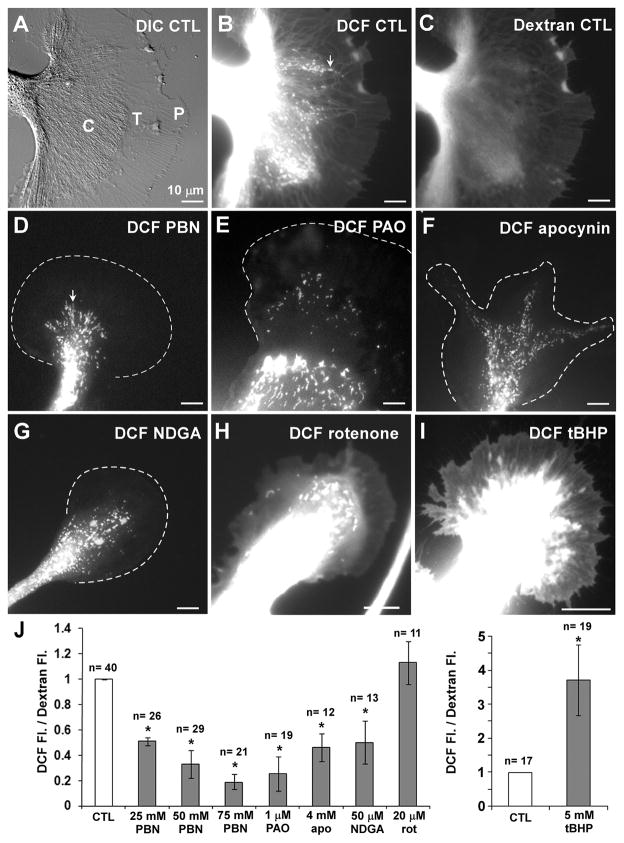
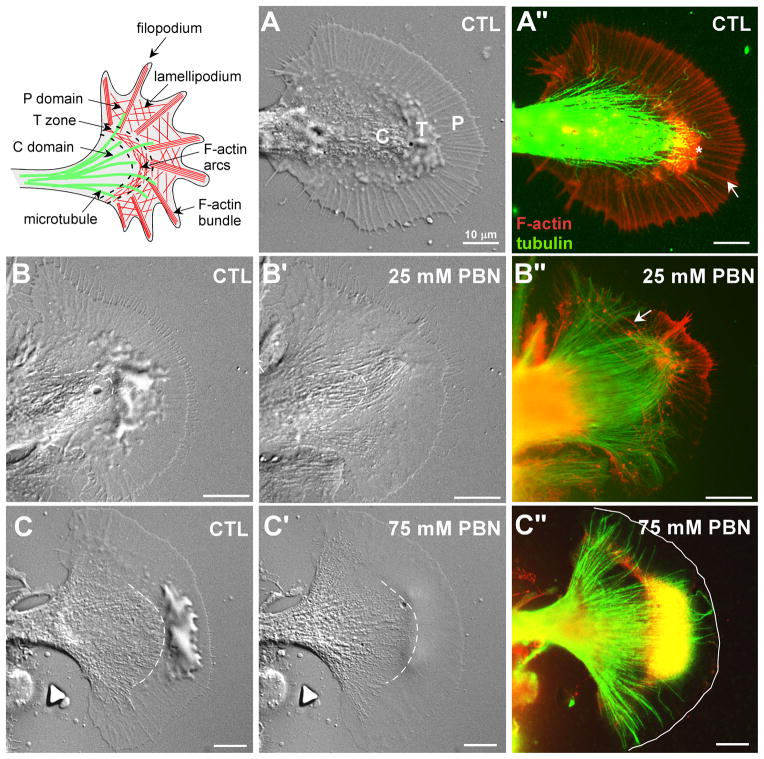
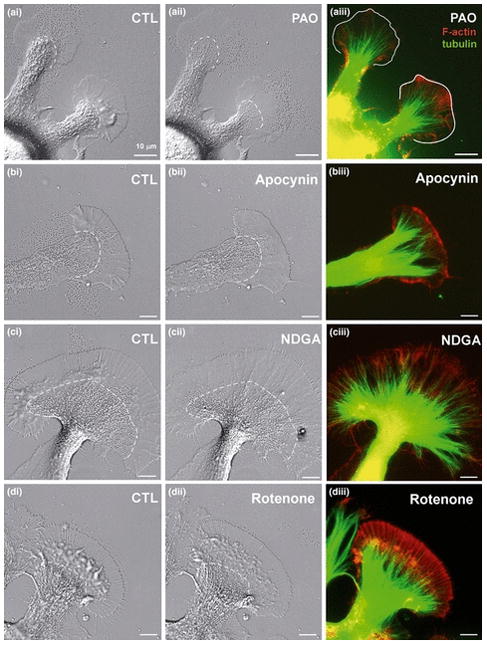
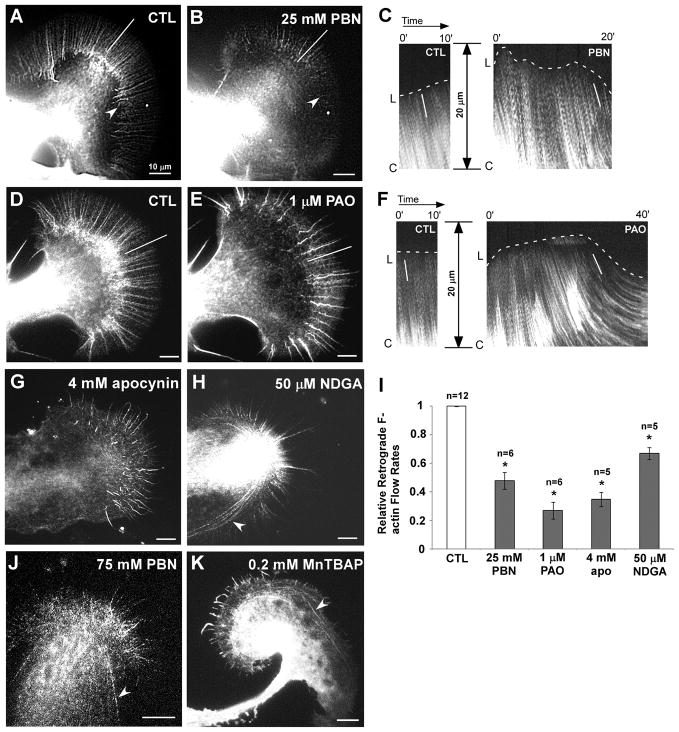
Reactive oxygen species are well known for their damaging effects due to oxidation of lipids, proteins and DNA that ultimately result in cell death. Accumulating evidence indicates that reactive oxygen species also have important signaling functions in cell proliferation, differentiation, cell motility and apoptosis. Here, we tested the hypothesis whether reactive oxygen species play a physiological role in regulating F-actin structure and dynamics in neuronal growth cones. Lowering cytoplasmic levels of reactive oxygen species with a free radical scavenger, N-tert-butyl-alpha-phenylnitrone, or by inhibiting specific sources of reactive oxygen species, such as NADPH oxidases or lipoxygenases, reduced the F-actin content in the peripheral domain of growth cones. Fluorescent speckle microscopy revealed that these treatments caused actin assembly inhibition, reduced retrograde actin flow and increased contractility of actin structures in the transition zone referred to as arcs, possibly by activating the Rho pathway. Reduced levels of reactive oxygen species ultimately resulted in disassembly of the actin cytoskeleton. When neurons were cultured overnight in conditions of reduced free radicals, growth cone formation and neurite outgrowth were severely impaired. Therefore, we conclude that physiological levels of reactive oxygen species are critical for maintaining a dynamic F-actin cytoskeleton and controlling neurite outgrowth.


Figures

Figure 1
Figure 1. ROS imaging in Aplysia bag cell growth cones
(A) DIC image of a control (CTL) growth cone. P and C domain plus T zone are indicated. (B) DCF image of growth cone in (A) shows ROS levels in the cytoplasm as well as intracellular compartments, such as potential mitochondria (arrow). (C) Corresponding dextran fluorescence image reveals highest volume in the C domain. (D–I) DCF fluorescence images of growth cones treated for 15 min with 50 mM PBN (D), 1 μM PAO (E), 4 mM apocynin (apo) (F), 50 μM NDGA (G), 20 μM rotenone (rot) (H), or 5 mM tBHP (I), respectively. Leading edges of growth cones shown in (D–G) are marked with dashed line. (J) Quantification of volume-corrected ROS levels in the growth cone P domain. T-test: *p<0.05 (n = growth cones). Scale bars: 10 μm.
Figure 2
Figure 2. ROS depletion decreases F-actin content in growth cones
Upper left inset shows schematic of cytoplasmic domains, microtubules (green) and F-actin (red) subpopulations in the growth cone. (A) DIC image of a live control growth cone under control condition in ASW. (A”) Overlay image of F-actin (red) and microtubule (green) double labeling after fixation of growth cone in (A) shows filopodial F-actin bundles (white arrow) and an F-actin meshwork between filopodia in the P domain. Intrapodia in the T zone is marked with an asterisk. The C domain is rich in organelles and microtubules. (B-B”) 25 mM PBN treatment (20 min) decreased membrane ruffling and caused initial filopodial lengthening and extension of the C domain boundary (dashed line in B’; Video 1). The F-actin content was strongly reduced while microtubule extended into the P domain (B”). Arrow points towards actin arc. (C-C”) 75 mM PBN treatment (5 min) also reduced ruffling (C’; Video 2) and strongly depleted F-actin structures (C”, leading edge marked with solid line). Scale bars: 10 μm.
Figure 3
Figure 3. Inhibition of NADPH oxidases and lipoxygenases decreases F-actin content
(A-A”) NADPH oxidase inhibition by 1 μM PAO (10 min) caused flattening of the P domain and T zone and a slight C domain retraction (A’). Growth cone dynamics including actin retrograde flow was strongly reduced (Video 3). (A”) F-actin bundles and meshwork in the periphery were reduced and microtubules extended more towards the leading edge (marked with solid line). (B-B”) 4 mM apocynin treatment (10 min) resulted in flattening of P domain and the T zone as well as extension of the C domain (B’; Video 4). (B”) The actin bundles and meshwork in the P domain were decreased and microtubules extended into the actin-free periphery. (C-C”) 50 μM NDGA treatment (10 min) had similar effects on growth cones. The extension of the C domain was modest. There was significant filopodia elongation (C’, Video 5). (C”) NDGA treatment decreased F-actin content in the P domain, but elongated filopodia containing F-actin. (D-D”) 20 μM Rotenone treatment (10 min) did not result in significant changes in growth cone morphology, F-actin and microtubule cytoskeleton structure and content (Video 6). Scale bars: 10 μm.
Figure 4
Figure 4. ROS depletion affects F-actin dynamics
(A) F-actin dynamics of control growth cone. Neurons were injected with 20 μM Alexa 568-phalloidin, and time lapse movies were acquired using FSM (Video 7). White line demarks lamellipodia region used for kymographs shown in (C). (B) Same growth cone after 20 min in 25 mM PBN. Note the progressive decrease in F-actin content in the P domain (Video 7). Arrowhead indicates forward movement of actin recycling zone. (C) Kymographs of actin speckles taken in the P domain as indicated with white lines in (A) and (B) reveal leading edge protrusion in control and progressive decrease in F-actin flow from initial control rate of 3.6 μm/min to 2.1 μm/min after PBN treatment (white lines in kymograph). (D) Actin FSM image of another control growth cone. (E) Same growth cone after treatment with 1 μM PAO for 30 min, which causes disassembly of the actin cytoskeleton and forward shift of the recycling zone (Video 8; image is shown after 25 min). A temporary lengthening of filopodial bundles occurred simultaneously with flow reduction. (F) Kymographs of actin speckles taken in P domain as indicated with white lines in (D) and (E) show a decrease in flow rates from 4.0 μm/min in control to 1.5 μm/min after PAO treatment. (G) 4 mM apocynin treatment caused a decrease in actin flow rates, filopodial lengthening and finally F-actin disassembly (Video 9). (H) 50 μM NDGA resulted in an aggregation of actin arcs (arrowhead) (Video 10). (I) Quantification of actin retrograde flow rates. T-test: *p<0.005; n= number of growth cones. (J) 75 mM PBN resulted in an aggregation of actin arcs and contractile effects, similar to NDGA treatment (arrowhead) (Video 11). (K) Treatment with 0.2 mM MnTBAP resulted in temporary filopodia lengthening, arc aggregation (arrowhead) and overall network disassembly. Scale bars: 10 μm.
Figure 5
Figure 5. ROS depletion affects actin arc movement and aggregation
(A) Actin FSM image of control growth cone. Filopodial actin bundles in P domain and actin arcs in T zone (marked with white box) undergo retrograde flow (Video 11). (B) Inset shows actin arcs marked in (A). In control conditions, arcs move retrogradely with respect to the axis of growth (Video 12). (C) The same growth cone treated for 3 min with 75 mM PBN (Video 11). We observed inhibition of F-actin assembly at the leading edge and retraction of the F-actin network towards the C domain. (D) Inset shows arc aggregation in 75 mM PBN. A brief tugging of actin arcs towards the axis of growth occurred before retraction of the F-actin network (Video 12). (E) Four speckles on actin arcs were tracked over 10 second intervals in control (open triangles) and 75 mM PBN (closed diamonds) conditions, respectively. (F) Angle plots of arc movements with respect to axis of growth from 7 growth cones (dashed arrows represent average angle per growth cone. Treatment with 75 mM PBN resulted in tugging of arcs towards the direction of growth less than 90o. Angles in control were always greater than 90o. Thin solid lines represent example shown in (A) and (C). (G) Actin FSM image of control growth cone. (H) 20 μM LPA treatment for 15 min resulted in increased arc aggregation. (I) Line scans across arcs marked by short white lines in (A), (C), (G), and (H) show arc aggregation by increased normalized relative fluorescence intensities after PBN and LPA treatment, respectively, relative to controls. Schematic on the right shows orientation of line scans. (J) Integrated fluorescence intensities along the line scan per μm were normalized against control conditions. (n = number of growth cones). T-test: *p<0.01. Scale bars: 10 μm (in A, C, G, H); 5 μm (in B, D).
Figure 6
Figure 6. PBN treatment increases Rho activity in Aplysia CNS tissue
(A) Western blot analysis of total and active Rho, as assessed by rhotekin-pull down assay. Total Aplysia CNS tissue was incubated in LIS-ASW only, with 20 μM LPA or 75 mM PBN for 1 hr. (B) Densitometric quantification of Rho activity (active/total Rho) in three independent experiments. Both LPA treatment and PBN increased Rho activity relative to control.
Figure 7
Figure 7. Phosphotyrosine levels are decreased after ROS depletion
(A) Control growth cone labeled for total phosphotyrosine (PY) with monoclonal antibody 4G10. PY signals are increased at filopodia tips, leading edge and T zone ruffles (asterisk). 50 mM PBN (B), 1 μM PAO (C), 4 mM apocynin (D), and 50 μM NDGA (E) decreased PY signals in general and particularly along the leading edge. Note: NDGA treatment did not decrease PY levels in filopodia tips. (F) 20 μM rotenone did not affect PY signals in P domain, leading edge or filopodia tips. (G) Quantification of PY levels in the P domain of growth cones reveals that 50 mM PBN, 1 μM PAO, 4 mM apocynin, and 50 μM NDGA decreased ROS levels by 52%, 58%, 62%, and 60%, respectively. Data are from three independent experiments. T-test: *p<0.05 (n = number of growth cones). Scale bars: 10 μm.
Figure 8
Figure 8. ROS depletion reduces growth cone formation and neurite outgrowth
(A) Low magnification phase contrast image of a bag cell neuron with growth cones after one day in L15-ASW control condition. (A’) The same neuron imaged two days after plating had more, larger growth cones and longer neurites. (B) Neurons cultured for one day in 20 mM PBN had fewer, smaller and flatter growth cones at the ends of shorter neurites compared to controls. (B’) One day after PBN washout, the same cells have more, robust growth cones and longer neurites. The two cell bodies shown in (B) moved together between day one and two. (C) Quantification of percentage of cells that develop growth cones after one day in control medium, 20 mM PBN, 500 nM PAO, 2 mM apocynin and 25 μM NDGA (white bars) and on day two after washout of drugs between day one and two (gray bars). Between 43 and 255 cells were analyzed per condition in four independent experiments. T-test: *p<0.05. (D–E) Lowering ROS levels decreases neurite outgrowth. Population distribution of total neurite length per cell in control, 20 mM PBN (D), 500 nM PAO (E), 2 mM apocynin (E) and 25 μM NDGA (E) conditions on day one and on day two after washout. There was a significant decrease in total neurite length in neurons cultured in the presence of ROS drugs (open squares) when compared to L15-ASW control (open triangles) on day one. PBN and apocynin effects were partially reversible, while PAO and NDGA effects were not. Quantifications in (C), (D) and (E) were carried out with the same cells (n= number of cells). Most neurons have preexisting processes at the time of plating, explaining the differences in percentages of cells with growth cones and short neurites in some of the drug conditions. Scale bars: 200 μm.

Similar articles

Cited by

References

    1. Abo A, Pick E, Hall A, Totty N, Teahan CG, Segal AW. Activation of the NADPH oxidase involves the small GTP-binding protein p21rac1. Nature. 1991;353:668–670. - PubMed
    1. Alexandrova AY, Kopnin PB, Vasiliev JM, Kopnin BP. ROS up-regulation mediates Ras-induced changes of cell morphology and motility. Exp Cell Res. 2006;312:2066–2073. - PubMed
    1. Barrientos A, Moraes CT. Titrating the effects of mitochondrial complex I impairment in the cell physiology. J Biol Chem. 1999;274:16188–16197. - PubMed
    1. Bedard K, Krause KH. The NOX family of ROS-generating NADPH oxidases: physiology and pathophysiology. Physiol Rev. 2007;87:245–313. - PubMed
    1. Chang S, Rathjen FG, Raper JA. Extension of neurites on axons is impaired by antibodies against specific neural cell surface glycoproteins. J Cell Biol. 1987;104:355–362. - PMC - PubMed

Publication types