

Impact of macrophage toll-like receptor 4 deficiency on macrophage infiltration into adipose tissue and the artery wall in mice
- PMID: 19052722
- PMCID: PMC2615827
- DOI: 10.1007/s00125-008-1221-7
Impact of macrophage toll-like receptor 4 deficiency on macrophage infiltration into adipose tissue and the artery wall in mice
Abstract
Aims/hypothesis: Toll-like receptor 4 (TLR4) is a receptor for saturated fatty acids (SFAs), global deficiency of which has been shown to protect against inflammation, insulin resistance and atherosclerotic lesion formation. Because macrophages express Tlr4 and are important in insulin resistance and atherosclerotic lesion formation due to their infiltration of white adipose tissue (WAT) and the artery wall, respectively, we hypothesised that deficiency of macrophage TLR4 could protect against these disorders.
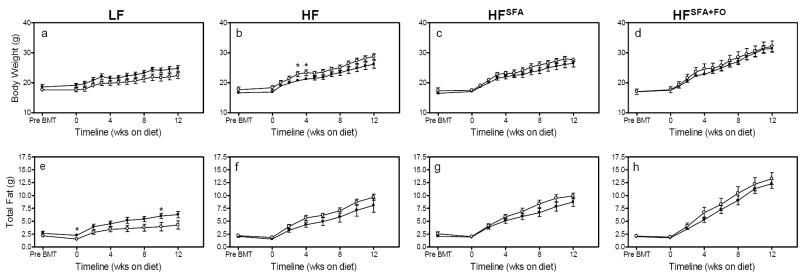
Methods: Bone marrow transplantation of agouti, LDL-receptor deficient (A(y)/a; Ldlr (-/-)) mice with marrow from either C57BL/6 or Tlr4 (-/-) mice was performed. Recipient mice with Tlr4 (+/+) marrow (MthetaTLR4(+/+)) or with Tlr4 (-/-) marrow (MthetaTLR4(-/-)) were then placed on one of four diets: (1) low fat; (2) high fat; (3) high fat rich in SFAs (HF(SFA)); and (4) HF(SFA) supplemented with fish oil.
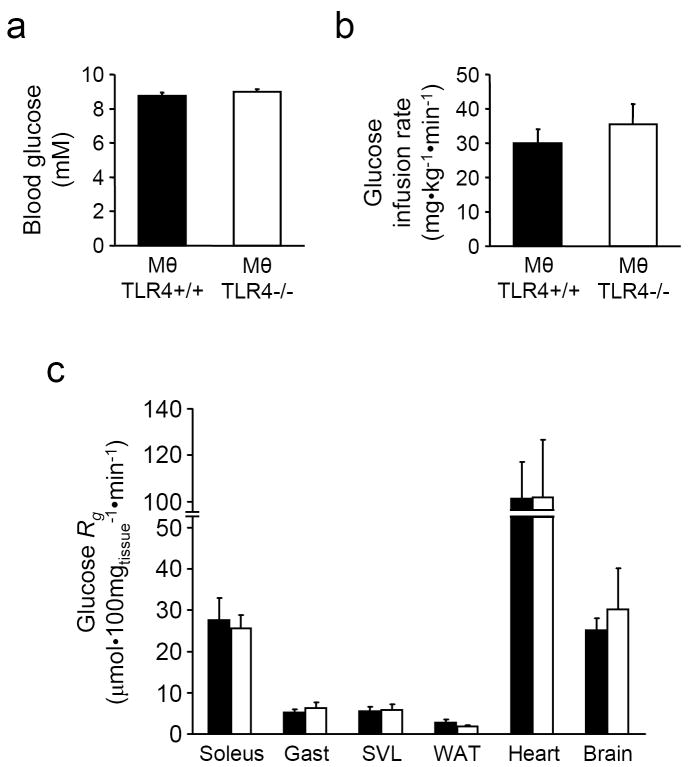
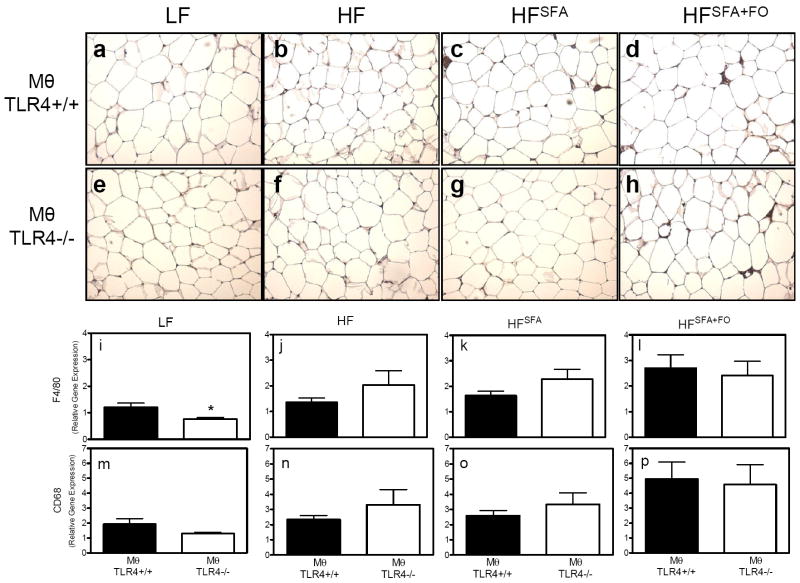
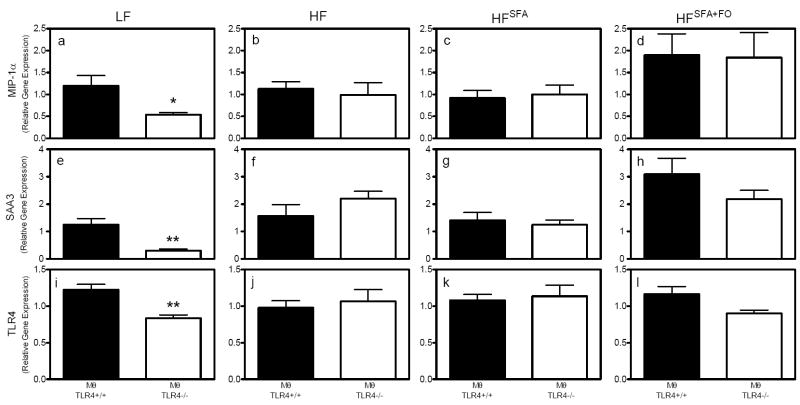
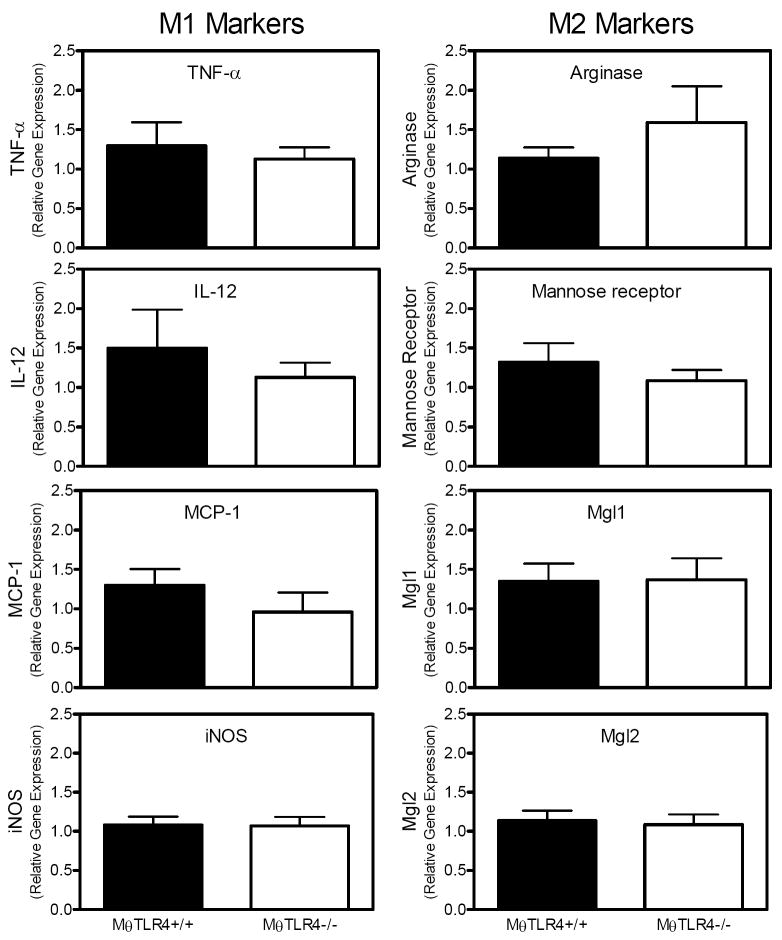
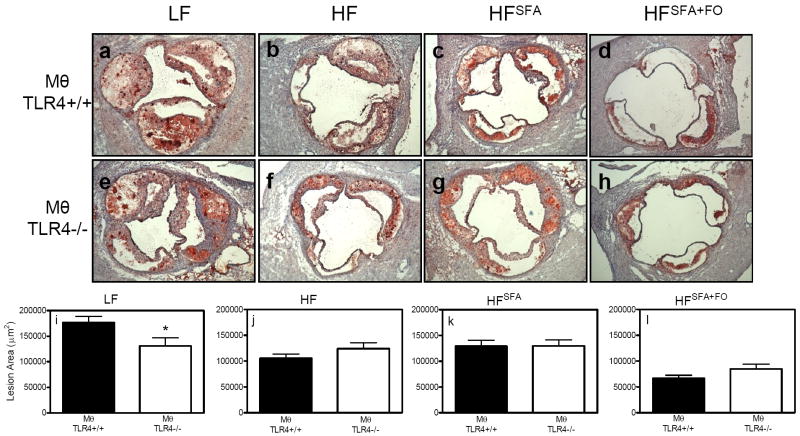
Results: There were no differences in body composition or plasma lipids between MthetaTLR4(+/+) and MthetaTLR4(-/-) mice on any of the diets. However, we observed a decrease in some macrophage and inflammatory markers in WAT of female low fat-fed MthetaTLR4(-/-) mice compared with MthetaTLR4(+/+) mice. MthetaTLR4(-/-) mice fed low-fat diet also displayed decreased atherosclerotic lesion area. There were no differences in macrophage accrual in WAT or atherosclerosis between MthetaTLR4(+/+) and MthetaTLR4(-/-) mice fed any of the high-fat diets. Finally, no difference was seen in insulin sensitivity between MthetaTLR4(+/+) and MthetaTLR4(-/-) mice fed the HF(SFA) diet.
Conclusions/interpretation: These data suggest that under certain dietary conditions, macrophage expression of Tlr4 can be an important mediator of macrophage accumulation in WAT and the artery wall.
Conflict of interest statement
Figures
Similar articles
-
Toll-like receptor 4 deficiency promotes the alternative activation of adipose tissue macrophages.Diabetes. 2012 Nov;61(11):2718-27. doi: 10.2337/db11-1595. Epub 2012 Jun 29. Diabetes. 2012. PMID: 22751700 Free PMC article.
-
Toll-like receptor 4 deficiency decreases atherosclerosis but does not protect against inflammation in obese low-density lipoprotein receptor-deficient mice.Arterioscler Thromb Vasc Biol. 2012 Jul;32(7):1596-604. doi: 10.1161/ATVBAHA.112.249847. Epub 2012 May 10. Arterioscler Thromb Vasc Biol. 2012. PMID: 22580897 Free PMC article.
-
Fibronectin Splicing Variants Containing Extra Domain A Promote Atherosclerosis in Mice Through Toll-Like Receptor 4.Arterioscler Thromb Vasc Biol. 2015 Nov;35(11):2391-400. doi: 10.1161/ATVBAHA.115.306474. Epub 2015 Oct 1. Arterioscler Thromb Vasc Biol. 2015. PMID: 26427793 Free PMC article.
-
C3H/HeJ mice carrying a toll-like receptor 4 mutation are protected against the development of insulin resistance in white adipose tissue in response to a high-fat diet.Diabetologia. 2007 Jun;50(6):1267-76. doi: 10.1007/s00125-007-0654-8. Epub 2007 Apr 11. Diabetologia. 2007. PMID: 17426960
-
The effect of dietary cholesterol on macrophage accumulation in adipose tissue: implications for systemic inflammation and atherosclerosis.Curr Opin Lipidol. 2009 Feb;20(1):39-44. doi: 10.1097/mol.0b013e32831bef8b. Curr Opin Lipidol. 2009. PMID: 19133410 Review.
Cited by
-
The free fatty acid receptor G protein-coupled receptor 40 (GPR40) protects from bone loss through inhibition of osteoclast differentiation.J Biol Chem. 2013 Mar 1;288(9):6542-51. doi: 10.1074/jbc.M112.429084. Epub 2013 Jan 18. J Biol Chem. 2013. PMID: 23335512 Free PMC article.
-
Attenuated Pik3r1 expression prevents insulin resistance and adipose tissue macrophage accumulation in diet-induced obese mice.Diabetes. 2012 Oct;61(10):2495-505. doi: 10.2337/db11-1433. Epub 2012 Jun 14. Diabetes. 2012. PMID: 22698915 Free PMC article.
-
Transcriptional profiles of leukocyte populations provide a tool for interpreting gene expression patterns associated with high fat diet in mice.PLoS One. 2010 Jul 29;5(7):e11861. doi: 10.1371/journal.pone.0011861. PLoS One. 2010. PMID: 20686622 Free PMC article.
-
Atherosclerosis and Toll-Like Receptor4 (TLR4), Lectin-Like Oxidized Low-Density Lipoprotein-1 (LOX-1), and Proprotein Convertase Subtilisin/Kexin Type9 (PCSK9).Mediators Inflamm. 2024 Feb 27;2024:5830491. doi: 10.1155/2024/5830491. eCollection 2024. Mediators Inflamm. 2024. PMID: 38445291 Free PMC article. Review.
-
The role of monocytes in thrombotic diseases: a review.Front Cardiovasc Med. 2023 Jun 2;10:1113827. doi: 10.3389/fcvm.2023.1113827. eCollection 2023. Front Cardiovasc Med. 2023. PMID: 37332592 Free PMC article. Review.
References
-
- Wang Y, Beydoun MA. The obesity epidemic in the United States--gender, age, socioeconomic, racial/ethnic, and geographic characteristics: a systematic review and meta-regression analysis. Epidemiol Rev. 2007;29:6–28. - PubMed
-
- Reilly MP, Rader DJ. The metabolic syndrome: more than the sum of its parts? Circulation. 2003;108:1546–1551. - PubMed
-
- Moller DE, Kaufman KD. Metabolic syndrome: a clinical and molecular perspective. Annu Rev Med. 2005;56:45–62. - PubMed
-
- Reaven GM. Banting lecture 1988. Role of insulin resistance in human disease. Diabetes. 1988;37:1595–1607. - PubMed
-
- Adams KF, Schatzkin A, Harris TB, et al. Overweight, obesity, and mortality in a large prospective cohort of persons 50 to 71 years old. N Engl J Med. 2006;355:763–778. - PubMed
Publication types
MeSH terms
Substances
Grants and funding
- DK54902/DK/NIDDK NIH HHS/United States
- P60 DK020593/DK/NIDDK NIH HHS/United States
- U24 DK059637-019003/DK/NIDDK NIH HHS/United States
- R01 HL089466/HL/NHLBI NIH HHS/United States
- R01 HL089466-02/HL/NHLBI NIH HHS/United States
- T32 DK007563-21/DK/NIDDK NIH HHS/United States
- R56 DK054902/DK/NIDDK NIH HHS/United States
- R01 DK054902/DK/NIDDK NIH HHS/United States
- T32DK07563/DK/NIDDK NIH HHS/United States
- R01HL089466/HL/NHLBI NIH HHS/United States
- DK058404/DK/NIDDK NIH HHS/United States
- P30 DK058404/DK/NIDDK NIH HHS/United States
- P60 DK020593-199002/DK/NIDDK NIH HHS/United States
- R01 DK054902-05/DK/NIDDK NIH HHS/United States
- DK59637/DK/NIDDK NIH HHS/United States
- P30 DK020593/DK/NIDDK NIH HHS/United States
- T32 DK007563/DK/NIDDK NIH HHS/United States
- DK20593/DK/NIDDK NIH HHS/United States
- P30 DK058404-01A19003/DK/NIDDK NIH HHS/United States
- P30 DK058404-01A10001/DK/NIDDK NIH HHS/United States
- U24 DK059637/DK/NIDDK NIH HHS/United States
LinkOut - more resources
Full Text Sources
Molecular Biology Databases
Research Materials
Miscellaneous
