

A genomic approach to colon cancer risk stratification yields biologic insights into therapeutic opportunities
- PMID: 19050079
- PMCID: PMC2592987
- DOI: 10.1073/pnas.0806674105
A genomic approach to colon cancer risk stratification yields biologic insights into therapeutic opportunities
Erratum in
- Proc Natl Acad Sci U S A. 2009 Apr 21;106(16):6878
Retraction in
-
Retraction for Garman et al: A genomic approach to colon cancer risk stratification yields biologic insights into therapeutic opportunities.Proc Natl Acad Sci U S A. 2011 Oct 18;108(42):17569. doi: 10.1073/pnas.1115170108. Epub 2011 Oct 3. Proc Natl Acad Sci U S A. 2011. PMID: 21969600 Free PMC article. No abstract available.
Abstract
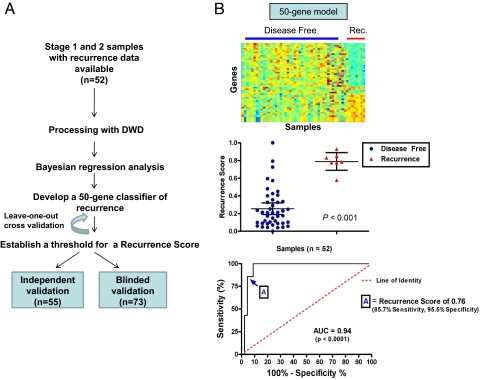
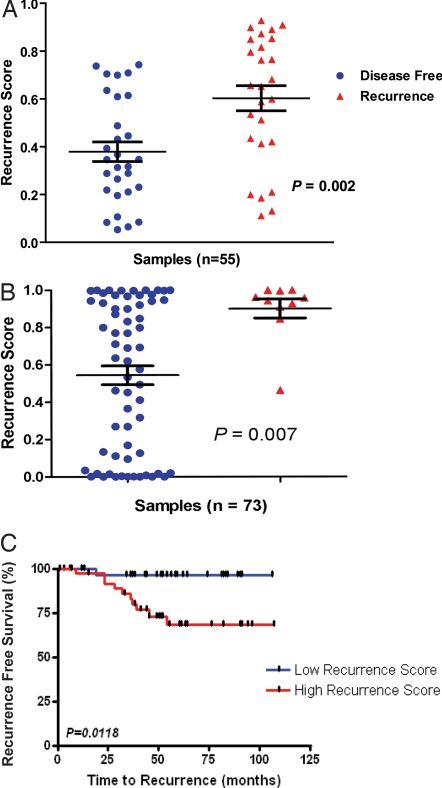
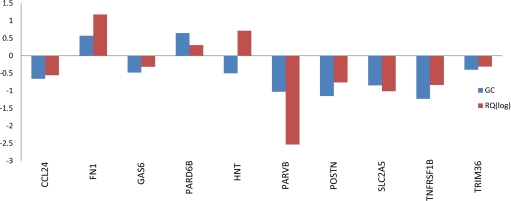
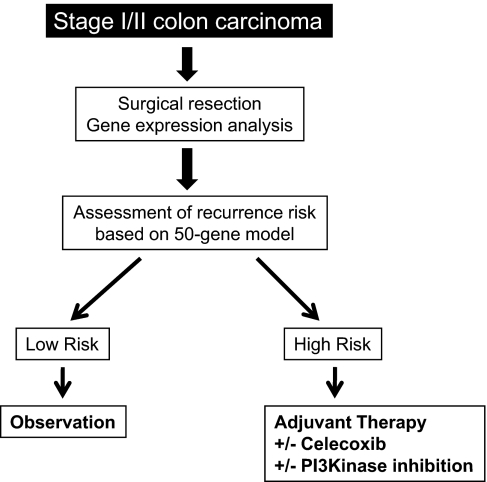
Gene expression profiles provide an opportunity to dissect the heterogeneity of solid tumors, including colon cancer, to improve prognosis and predict response to therapies. Bayesian binary regression methods were used to generate a signature of disease recurrence in patients with resected early stage colon cancer validated in an independent cohort. A 50-gene signature was developed that effectively distinguished early stage colon cancer patients with a low or high risk of disease recurrence. RT-PCR analysis of the 50-gene signature validated 9 of the top 10 differentially expressed genes. When applied to two independent validation cohorts of 55 and 73 patients, the 50-gene model accurately predicted recurrence. Standard Kaplan-Meier survival analysis confirmed the prognostic accuracy (P < 0.01, log rank), as did multivariate Cox proportional hazard models. We tested potential targeted therapeutic options for patients at high risk for disease recurrence and found a clinically important relationship between sensitivity to celecoxib, LY-294002 (PI3kinase inhibitor), retinol, and sulindac in colon cancer cell lines expressing the poor prognostic phenotype (P < 0.01, t test), which performed better than standard chemotherapy (5-FU and oxaliplatin). We present a genomic strategy in early stage colon cancer to identify patients at highest risk of recurrence. An ability to move beyond current staging by refining the estimation of prognosis in early stage colon cancer also has implications for individualized therapy.
Conflict of interest statement
The authors declare no conflict of interest.
Figures

Comment in
-
Findings of research misconduct.NIH Guide Grants Contracts. 2015 Nov 20:NOT-OD-16-021. NIH Guide Grants Contracts. 2015. PMID: 26601329 Free PMC article. No abstract available.
-
Findings of Research Misconduct.Fed Regist. 2015 Nov 9;80(216):69230-69231. Fed Regist. 2015. PMID: 27737266 Free PMC article. No abstract available.
Similar articles
-
Prognostic and predictive value of a microRNA signature in stage II colon cancer: a microRNA expression analysis.Lancet Oncol. 2013 Dec;14(13):1295-306. doi: 10.1016/S1470-2045(13)70491-1. Epub 2013 Nov 13. Lancet Oncol. 2013. PMID: 24239208
-
Prognostic and predictive value of an autophagy-related signature for early relapse in stages I-III colon cancer.Carcinogenesis. 2019 Jul 20;40(7):861-870. doi: 10.1093/carcin/bgz031. Carcinogenesis. 2019. PMID: 30933267
-
Gene expression profiles and molecular markers to predict recurrence of Dukes' B colon cancer.J Clin Oncol. 2004 May 1;22(9):1564-71. doi: 10.1200/JCO.2004.08.186. Epub 2004 Mar 29. J Clin Oncol. 2004. PMID: 15051756
-
Oncotype DX(®) colon cancer assay for prediction of recurrence risk in patients with stage II and III colon cancer: A review of the evidence.Surg Oncol. 2015 Jun;24(2):61-6. doi: 10.1016/j.suronc.2015.02.001. Epub 2015 Feb 14. Surg Oncol. 2015. PMID: 25770397 Review.
-
Personalizing colon cancer adjuvant therapy: selecting optimal treatments for individual patients.J Clin Oncol. 2015 Jun 1;33(16):1787-96. doi: 10.1200/JCO.2014.60.0213. Epub 2015 Apr 27. J Clin Oncol. 2015. PMID: 25918287 Review.
Cited by
-
Colon cancer molecular subtypes identified by expression profiling and associated to stroma, mucinous type and different clinical behavior.BMC Cancer. 2012 Jun 19;12:260. doi: 10.1186/1471-2407-12-260. BMC Cancer. 2012. PMID: 22712570 Free PMC article.
-
BRCA-Monet: a breast cancer specific drug treatment mode-of-action network for treatment effective prediction using large scale microarray database.BMC Syst Biol. 2013;7 Suppl 5(Suppl 5):S5. doi: 10.1186/1752-0509-7-S5-S5. Epub 2013 Dec 9. BMC Syst Biol. 2013. PMID: 24564956 Free PMC article.
-
The role of bioinformatics in studying rheumatic and autoimmune disorders.Nat Rev Rheumatol. 2011 Jun 21;7(8):489-94. doi: 10.1038/nrrheum.2011.87. Nat Rev Rheumatol. 2011. PMID: 21691330
-
Gene expression-based chemical genomics identifies potential therapeutic drugs in hepatocellular carcinoma.PLoS One. 2011;6(11):e27186. doi: 10.1371/journal.pone.0027186. Epub 2011 Nov 7. PLoS One. 2011. PMID: 22087264 Free PMC article.
-
Prognostic and predictive markers in stage II colon cancer: is there a role for gene expression profiling?Clin Colorectal Cancer. 2011 Jun;10(2):73-80. doi: 10.1016/j.clcc.2011.03.001. Epub 2011 Apr 22. Clin Colorectal Cancer. 2011. PMID: 21859557 Free PMC article. Review.
References
-
- Jemal A, et al. Cancer Statistics, 2008. CA Cancer J Clin. 2008;58:71–96. - PubMed
-
- Fearon ER, Vogelstein B. A genetic model for colorectal tumorigenesis. Cell. 1990;61:759–767. - PubMed
-
- Vogelstein B, et al. Genetic alterations during colorectal-tumor development. N Engl J Med. 1988;319:525–532. - PubMed
-
- Sjoblom T, et al. The consensus coding sequences of human breast and colorectal cancers. Science. 2006;314:268–274. - PubMed
-
- Wood LD, et al. The genomic landscapes of human breast and colorectal cancers. Science. 2007;318:1108–1113. - PubMed
Publication types
MeSH terms
Substances
Grants and funding
LinkOut - more resources
Full Text Sources
Other Literature Sources
Molecular Biology Databases
