. 2008 Nov 26;28(48):12956-68.
doi: 10.1523/JNEUROSCI.2890-08.2008.

Postnatal differentiation of basket cells from slow to fast signaling devices

Affiliations

Postnatal differentiation of basket cells from slow to fast signaling devices

Daniel Doischer et al. J Neurosci. .

Abstract

Gamma frequency (30-100 Hz) oscillations in the mature cortex underlie higher cognitive functions. Fast signaling in GABAergic interneuron networks plays a key role in the generation of these oscillations. During development of the rodent brain, gamma activity appears at the end of the first postnatal week, but frequency and synchrony reach adult levels only by the fourth week. However, the mechanisms underlying the maturation of gamma activity are unclear. Here we demonstrate that hippocampal basket cells (BCs), the proposed cellular substrate of gamma oscillations, undergo marked changes in their morphological, intrinsic, and synaptic properties between postnatal day 6 (P6) and P25. During maturation, action potential duration, propagation time, duration of the release period, and decay time constant of IPSCs decreases by approximately 30-60%. Thus, postnatal development converts BCs from slow into fast signaling devices. Computational analysis reveals that BC networks with young intrinsic and synaptic properties as well as reduced connectivity generate oscillations with moderate coherence in the lower gamma frequency range. In contrast, BC networks with mature properties and increased connectivity generate highly coherent activity in the upper gamma frequency band. Thus, late postnatal maturation of BCs enhances coherence in neuronal networks and will thereby contribute to the development of cognitive brain functions.


Figures

Figure 1.
Figure 1.
Morphological identification of dentate gyrus BCs in young (P6–P10) and mature (P18–P25) GAD67–GFP-expressing mice. A, B, Confocal image stacks from a horizontal section (50 μm) of the dentate gyrus in a young (P6) and a mature (P21) transgenic mouse. C, D, GFP-expressing cells were filled with biocytin during the recording and subsequently visualized using DAB as chromogen. Light-microscopic images show a pair of young (left) and of mature (right) synaptically coupled BCs in the mouse dentate gyrus. Note that the axonal arborizations are located in the GC layer, identifying the cells as BCs. Dashed lines indicate borders of the granule cell layer. Arrowheads point to axon collaterals. E–G, Confocal images confirm colocalization of GAD67–GFP and PV in an identified BC at P12. E, A GABAergic interneuron was identified in the slice preparation of the dentate gyrus on the basis of the GAD67–GFP signal. The arrow points to the cell body of the selected cell. F, The same cell was biocytin filled and stained with Alexa Fluor 647-conjugated streptavidin. Arrowheads point to axonal collaterals in the granule cell layer. G, The BC was identified as PV positive by immunohistochemistry. Note the weaker GFP and PV labeling of the recorded cell compared with neighboring cells because of intracellular dialysis with the pipette solution (recording time, ∼10 min). Arrow points to the same cell as in E. gcl, Granule cell layer; ml, molecular layer.
Figure 2.
Figure 2.
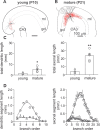
Increase in complexity and extent of the dendritic tree and the axonal arbor of BCs during postnatal development. A, B, Camera lucida reconstruction of a young (P10) and a mature (P21) BC. Somata and dendrites are depicted in black, and axons are depicted in red. C, Summary bar graphs of total dendritic and axonal length in young (P6–P10, 4 cells) and mature (P18–P21, 5 cells) BCs. Superimposed symbols represent data from single experiments (triangle, young BCs; circles, mature BCs). D, Average length of dendritic and axonal segments plotted versus branch order. Data were fitted with Gaussian functions. Significant differences (p < 0.01) between young and mature BCs were found for the average dendritic segment length between branch order 3–6 and for the average axonal segment length between branch order 9–14. Error bars indicate SEM. gcl, Granule cell layer; ml, molecular layer. *p < 0.05; **p < 0.01.
Figure 3.
Figure 3.
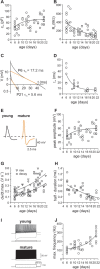
Developmental changes in passive and active membrane properties of BCs. A, B, Summary graphs of total membrane capacitance (cm) and input resistance (Rin) plotted versus postnatal age. C, Logarithmic plot of voltage changes in a young (P6) and a mature (P21) BC after short (0.2 ms) hyperpolarizing (young, 0.5 nA; mature, 1 nA) current injections; regression lines (orange) are shown superimposed. D, Summary graph of membrane time constant (τm) plotted versus age. E, Traces of single action potentials evoked during the first 5 ms of a 1 s somatic suprathreshold current injection in a young (black) and a mature (orange) BC. Both cells were held at −70 mV before stimulation. F–H, Summary plots of the developmental change in peak amplitude (F), maximal rate of rise (triangles) and maximal rate of decay (circles; G), and duration at half-maximal amplitude of action potentials (H). Circles represent single data points. Lines correspond to exponential functions plus offset (A, B, D, F, G, H, J) fitted to the data. I, Young (P6) and mature (P21) BCs fire high-frequency trains of action potentials when depolarized with 1-s-long positive current injections. Traces show maximal discharges of a young and a mature BC (young BC, 300 pA; mature BC, 950 pA) and are superimposed with hyperpolarizing traces evoked by a negative current injection (−100 pA in both cells). J, Maximal discharge frequency plotted as a function of age. Each circle represents the average frequency calculated from the inverse of the interspike intervals in trains of action potentials. max., Maximal.
Figure 4.
Figure 4.
Speed and temporal precision of action potential propagation in BC axons increases during postnatal development. A, Schematic illustration of somatic whole-cell recording from a BC combined with extracellular stimulation of BC axons in the GC layer (gcl) at a distance of 70–1000 μm from the soma. Eleven consecutively evoked antidromic action potentials recorded somatically in a young (P8; black traces) and a mature (P21; gray traces) BC. In 3 of 11 trials, extracellular stimulation of a young BC did not evoke action potentials (arrows). BCs were held at −70 mV before stimulation. B, Latency between stimulus artifact and action potential (see Materials and Methods) was plotted versus distance between stimulation and recording site for young (P6–P10, 4 cells; left) and mature (P18–P25, 4 cells; right) BCs. Conduction velocity was determined from the linear fit of the data obtained in young (black line) and mature (gray line) BCs. Average values (filled symbols) are superimposed with data from single experiments (open symbols). C, Superposition of the 11 consecutive traces shown in A. Note the less precise timing of action potentials in the young BC (black traces) compared with the mature BC (gray traces). D, Left, Bar graph summarizes the CV of the conduction velocity of antidromic action potentials in young (P6–P10, 4 cells) and mature (P18–P25, 4 cells) BCs. Superimposed circles represent data from single experiments. Right, Bar graph summarizes the reliability of antidromic action potentials (AP) recorded at the soma of BCs (holding potential, −70 mV) evoked by extracellular stimulation in the granule cell layer (gcl). **p < 0.01.
Figure 5.
Figure 5.
Precision of quantal GABA release at BC output synapses increases during postnatal development. A, Single action potentials (top traces) evoke single unitary IPSCs (bottom traces) in a young (P6; left) and a mature (P21; right) BC–BC pair. Eight unitary IPSCs are superimposed. Synaptic latency histograms of unitary IPSCs are shown below the traces for the same paired recordings (left, young BC–BC pair; right, mature BC–BC pair). B–D, Summary plot of synaptic latencies (B), the CV of synaptic latencies (C), and the proportion of transmission failures (D), at both BC–BC (filled circles) and BC–GC (open triangles) synapses at various postnatal ages. Lines correspond to exponential functions fitted to the data from BC–BC (continuous line) and BC–GC (dashed line) pairs. Red circles represent average values from BC–BC pairs, and red triangles represent average values from BC–GC pairs in the age range of P6–P10 and of P18–P25. E, Summary bar graphs of synaptic latency, CV of synaptic latencies, and transmission failures at young (P6–P10) and mature (P18–P25) BC–BC (filled circles) and BC–GC (open triangles) synapses. The bottom right bar graph summarizes the reliability of antidromic action potentials (AP) recorded at the soma of young and mature BCs during extracellular stimulation in the GC layer for direct comparison. **p < 0.01.
Figure 6.
Figure 6.
Unitary inhibitory postsynaptic conductance at BC output synapses becomes stronger and faster during postnatal development. A, Unitary IPSCs recorded in a pair of GFP-positive BCs in the young (P6; left) and the mature (P21; right) dentate gyrus. Presynaptic action potentials are shown on top, unitary IPSCs are shown superimposed in the center (6 traces), and average unitary IPSCs (from 30 traces) are depicted below. The decay phases of average IPSCs were fitted with a double-exponential function to determine the decay time constant (τw), and the quality of the fit is shown with gray superimposed lines. Arrows point to average IPSCs from a young (black) and a mature (orange) BC–BC paired recording. Traces were normalized to the peak amplitude and superimposed. Note that the decay time constant of unitary IPSCs is faster in the mature than in the young BC–BC pair. B, Summary plot of peak amplitudes (left) and amplitude-weighted decay time constants (τw; right) of unitary IPSCs recorded at BC–BC (filled circles) and BC–GC (open triangles) synapses at various postnatal ages (postsynaptic holding potential, −70 mV). Lines correspond to sigmoidal functions fitted to the data from BC–BC (continuous line) and BC–GC pairs (dashed line) for peak amplitudes (left) and exponential functions for τw (right). Red filled circles represent average values from BC–BC pairs, and red open triangles represent average values from BC–GC pairs in the age range of P6–P10 and of P18–P25. C, Connection probability between two BCs from 152 simultaneous recordings at P6–P25 (filled bars; P6–P8, 3 of 42 connected; P9–P11, 4 of 36 connected, P12–P17, 4 of 28 connected; P18–P25, 7 of 46 connected). Connection probability between presynaptic BCs and postsynaptic GCs from 148 paired recordings (open bars; P6–P8, 9 of 90 connected; P9–P11, 4 of 26 connected, P12–P17, 6 of 14 connected; P18–P25, 10 of 18 connected). D, Zolpidem (5 μm), a benzodiazepine type I receptor agonist, increases the decay time constant (τw) of IPSCs evoked by extracellular axon stimulation in mature but not in young BCs. **p < 0.01.
Figure 7.
Figure 7.
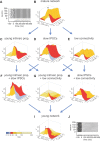
Difference in coherence levels and frequency tuning of young and mature interneuron network models. A, Raster plot illustrates the activity of the interneuron network model with mature properties at the maximal coherence level. Each dot represents an action potential during one simulation run (−150 to 500 ms); index of neurons (1–200) is plotted on the y-axis. The graph below the raster plot represents the spike-time histogram (bin width, 1 ms; maximal amplitude, 100 neurons). Tonic excitation was applied at random time points (−150 ms ≤ t < −100 ms); inhibitory synapses were enabled at t ≥ 0 ms. Coherence was determined during the last 100 ms of the simulation period. B–I, Three-dimensional plots of the coherence measure κ versus the tonic excitatory drive (Iμ) and the unitary peak conductance (gsyn). The height of the peaks in the three-dimensional plots indicates the level of synchrony in the network, quantified by κ. Corresponding network frequencies (fμ) are indicated by the color code superimposed on the surface of the plots (see scale bar at the bottom). The heterogeneity of the excitatory drive (Iσ /Iμ) was 10%; the reversal potential of the inhibitory conductance was −55 mV, reflecting shunting inhibition between P6 and P25 (Chavas and Marty, 2003; Vida et al., 2006; Banke and McBain, 2007). For additional details, see Materials and Methods. Simulations were started with a mature network (B). Subsequently, intrinsic, synaptic, and network parameters were changed stepwise to reproduce properties of the young network (I). The mature interneuron network (B) generates gamma oscillations with high coherence (maximal κ = 0.74) in the upper gamma frequency range (50–90 Hz; orange). Introduction of young intrinsic properties (prop.), including slow intrinsic membrane properties, broad action potentials, and slow action potential conduction velocity (C) or slow decay of the IPSC (D), decreases coherence and reduces network frequency to the lower gamma range (30–50 Hz; red). Introduction of low network connectivity (E; Msyn = 40) also reduces coherence, but it keeps oscillatory frequency largely unchanged (50–90 Hz; yellow). Surprisingly, the combination of young intrinsic properties with slow IPSCs (F) results in an increase in peak coherence, whereas network frequency remains low. In contrast, the combination of low connectivity with young intrinsic properties (G) or slow IPSCs (H) results in a further marked reduction in coherence. When all properties are combined to simulate the young network (I), oscillations are generated at low coherence (maximal κ = 0.39) in the lower gamma range (30–50 Hz). J, Raster plot of network activity in a network with young properties at the maximal level of coherence. The asterisk and triangle in B and I indicate parameter settings for the raster plots.
Figure 8.
Figure 8.
Schematic illustration of the sequence of events involved in the generation of inhibitory signals at BC output synapses in the young and the mature dentate gyrus of GAD67–GFP mice. From left to right: a somatic action potential, axonal action potential propagation, time course of quantal transmitter release, and unitary IPSCs in young (top) and mature (bottom) networks are shown. The percent change of the given property of BC signaling at young (P6–P10) and mature (P18–P25) developmental stages is shown in brackets. Note that the combination of changes in these parameters underlies the emergence of fast signaling properties in BCs during development. See Results and Discussion for details. half-dur., Half-duration; conduc. time, conduction time; peak amp., peak amplitude.

Similar articles

Cited by

References

    1. Banke TG, McBain CJ. GABAergic input onto CA3 hippocampal interneurons remains shunting throughout development. J Neurosci. 2007;26:11720–11725. - PMC - PubMed
    1. Bartos M, Vida I, Frotscher M, Geiger JRP, Jonas P. Rapid signaling at inhibitory synapses in a dentate gyrus interneuron network. J Neurosci. 2001;21:2687–2698. - PMC - PubMed
    1. Bartos M, Vida I, Frotscher M, Meyer A, Monyer H, Geiger JRP, Jonas P. Fast synaptic inhibition promotes synchronized gamma oscillations in hippocampal interneuron networks. Proc Natl Acad Sci USA. 2002;99:13222–13227. - PMC - PubMed
    1. Bartos M, Vida I, Jonas P. Synaptic mechanisms of synchronized gamma oscillations in inhibitory interneuron networks. Nat Rev Neurosci. 2007;8:45–56. - PubMed
    1. Bekkers JM, Delaney AJ. Modulation of excitability by α-dendrotoxin-sensitive potassium channels in neocortical pyramidal neurons. J Neurosci. 2001;21:6553–6560. - PMC - PubMed

Publication types

MeSH terms

Substances

LinkOut - more resources