Analysis of cell surface proteome changes via label-free, quantitative mass spectrometry
- PMID: 19036722
- PMCID: PMC2667347
- DOI: 10.1074/mcp.M800172-MCP200
Analysis of cell surface proteome changes via label-free, quantitative mass spectrometry
Abstract
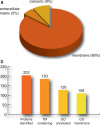
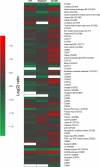
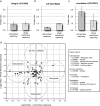
We present a mass spectrometry-based strategy for the specific detection and quantification of cell surface proteome changes. The method is based on the label-free quantification of peptide patterns acquired by high mass accuracy mass spectrometry using new software tools and the cell surface capturing technology that selectively enriches glycopeptides exposed to the cell exterior. The method was applied to monitor dynamic protein changes in the cell surface glycoproteome of Drosophila melanogaster cells. The results led to the construction of a cell surface glycoprotein atlas consisting of 202 cell surface glycoproteins of D. melanogaster Kc167 cells and indicated relative quantitative changes of cell surface glycoproteins in four different cellular states. Furthermore we specifically investigated cell surface proteome changes upon prolonged insulin stimulation. The data revealed insulin-dependent cell surface glycoprotein dynamics, including insulin receptor internalization, and linked these changes to intracellular signaling networks.
Figures


Similar articles
-
Monitoring Dynamic Changes of the Cell Surface Glycoproteome by Quantitative Proteomics.Methods Mol Biol. 2017;1647:47-59. doi: 10.1007/978-1-4939-7201-2_3. Methods Mol Biol. 2017. PMID: 28808994
-
Modularity and hormone sensitivity of the Drosophila melanogaster insulin receptor/target of rapamycin interaction proteome.Mol Syst Biol. 2011 Nov 8;7:547. doi: 10.1038/msb.2011.79. Mol Syst Biol. 2011. PMID: 22068330 Free PMC article.
-
Analysis of Drosophila melanogaster proteome dynamics during embryonic development by a combination of label-free proteomics approaches.Proteomics. 2016 Aug;16(15-16):2068-80. doi: 10.1002/pmic.201500482. Epub 2016 May 10. Proteomics. 2016. PMID: 27029218 Free PMC article.
-
Mass Spectrometry-Based Chemical and Enzymatic Methods for Global Analysis of Protein Glycosylation.Acc Chem Res. 2018 Aug 21;51(8):1796-1806. doi: 10.1021/acs.accounts.8b00200. Epub 2018 Jul 16. Acc Chem Res. 2018. PMID: 30011186 Free PMC article. Review.
-
Chemical isotope labeling for quantitative proteomics.Mass Spectrom Rev. 2023 Mar;42(2):546-576. doi: 10.1002/mas.21709. Epub 2021 Jun 6. Mass Spectrom Rev. 2023. PMID: 34091937 Free PMC article. Review.
Cited by
-
CD109 Overexpression in Pancreatic Cancer Identified by Cell-Surface Glycoprotein Capture.J Proteomics Bioinform. 2014;Suppl 10:S10003. doi: 10.4172/jpb.S10-003. J Proteomics Bioinform. 2014. PMID: 25635161 Free PMC article.
-
Life is sweet! A novel role for N-glycans in Drosophila lifespan.Fly (Austin). 2011 Jan-Mar;5(1):18-24. doi: 10.4161/fly.5.1.13920. Epub 2011 Jan 1. Fly (Austin). 2011. PMID: 21057214 Free PMC article. Review.
-
Targeting the endothelial progenitor cell surface proteome to identify novel mechanisms that mediate angiogenic efficacy in a rodent model of vascular disease.Physiol Genomics. 2013 Nov 1;45(21):999-1011. doi: 10.1152/physiolgenomics.00097.2013. Epub 2013 Sep 10. Physiol Genomics. 2013. PMID: 24022221 Free PMC article.
-
Coupling enrichment methods with proteomics for understanding and treating disease.Proteomics Clin Appl. 2015 Feb;9(1-2):33-47. doi: 10.1002/prca.201400097. Epub 2015 Jan 19. Proteomics Clin Appl. 2015. PMID: 25523641 Free PMC article. Review.
-
Paired Expression Analysis of Tumor Cell Surface Antigens.Front Oncol. 2017 Aug 21;7:173. doi: 10.3389/fonc.2017.00173. eCollection 2017. Front Oncol. 2017. PMID: 28871274 Free PMC article.
References
-
- Aebersold, R., and Mann, M. ( 2003) Mass spectrometry-based proteomics. Nature 422, 198–207 - PubMed
-
- Mueller, L. N., Brusniak, M. Y., Mani, D. R., and Aebersold, R. ( 2008) An assessment of software solutions for the analysis of mass spectrometry based quantitative proteomics data. J. Proteome Res. 7, 51–61 - PubMed
-
- Zhang, H., Yi, E. C., Li, X. J., Mallick, P., Kelly-Spratt, K. S., Masselon, C. D., Camp, D. G., II, Smith, R. D., Kemp, C. J., and Aebersold, R. ( 2005) High throughput quantitative analysis of serum proteins using glycopeptide capture and liquid chromatography mass spectrometry. Mol. Cell. Proteomics 4, 144–155 - PubMed
Publication types
MeSH terms
Substances
Grants and funding
LinkOut - more resources
Full Text Sources
Other Literature Sources
Molecular Biology Databases

