Pulsed contractions of an actin-myosin network drive apical constriction
- PMID: 19029882
- PMCID: PMC2822715
- DOI: 10.1038/nature07522
Pulsed contractions of an actin-myosin network drive apical constriction
Abstract
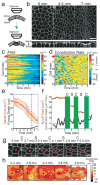
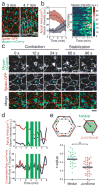
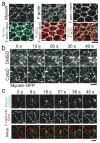
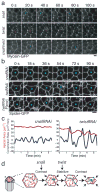
Apical constriction facilitates epithelial sheet bending and invagination during morphogenesis. Apical constriction is conventionally thought to be driven by the continuous purse-string-like contraction of a circumferential actin and non-muscle myosin-II (myosin) belt underlying adherens junctions. However, it is unclear whether other force-generating mechanisms can drive this process. Here we show, with the use of real-time imaging and quantitative image analysis of Drosophila gastrulation, that the apical constriction of ventral furrow cells is pulsed. Repeated constrictions, which are asynchronous between neighbouring cells, are interrupted by pauses in which the constricted state of the cell apex is maintained. In contrast to the purse-string model, constriction pulses are powered by actin-myosin network contractions that occur at the medial apical cortex and pull discrete adherens junction sites inwards. The transcription factors Twist and Snail differentially regulate pulsed constriction. Expression of snail initiates actin-myosin network contractions, whereas expression of twist stabilizes the constricted state of the cell apex. Our results suggest a new model for apical constriction in which a cortical actin-myosin cytoskeleton functions as a developmentally controlled subcellular ratchet to reduce apical area incrementally.
Figures


Similar articles
-
Chaos begets order: asynchronous cell contractions drive epithelial morphogenesis.Dev Cell. 2009 Jan;16(1):4-6. doi: 10.1016/j.devcel.2008.12.011. Dev Cell. 2009. PMID: 19154712
-
Integration of contractile forces during tissue invagination.J Cell Biol. 2010 Mar 8;188(5):735-49. doi: 10.1083/jcb.200910099. Epub 2010 Mar 1. J Cell Biol. 2010. PMID: 20194639 Free PMC article.
-
Apical domain polarization localizes actin-myosin activity to drive ratchet-like apical constriction.Nat Cell Biol. 2013 Aug;15(8):926-36. doi: 10.1038/ncb2796. Epub 2013 Jul 7. Nat Cell Biol. 2013. PMID: 23831726 Free PMC article.
-
Is mechano-sensitive expression of twist involved In mesoderm formation?Biol Cell. 2004 Sep;96(7):471-7. doi: 10.1016/j.biolcel.2004.04.009. Biol Cell. 2004. PMID: 15380614 Review.
-
Early mechanical selection of cell extrusion and extrusion signaling in cancer.Curr Opin Cell Biol. 2021 Oct;72:36-40. doi: 10.1016/j.ceb.2021.04.005. Epub 2021 May 24. Curr Opin Cell Biol. 2021. PMID: 34034216 Free PMC article. Review.
Cited by
-
Src kinases relax adherens junctions between the neighbors of apoptotic cells to permit apical extrusion.Mol Biol Cell. 2020 Nov 1;31(23):2557-2569. doi: 10.1091/mbc.E20-01-0084. Epub 2020 Sep 9. Mol Biol Cell. 2020. PMID: 32903148 Free PMC article.
-
Guiding cell migration by tugging.Curr Opin Cell Biol. 2013 Oct;25(5):619-26. doi: 10.1016/j.ceb.2013.06.003. Epub 2013 Jul 3. Curr Opin Cell Biol. 2013. PMID: 23830911 Free PMC article. Review.
-
Cytosystems dynamics in self-organization of tissue architecture.Nature. 2013 Jan 17;493(7432):318-26. doi: 10.1038/nature11859. Nature. 2013. PMID: 23325214 Review.
-
Cycling Rho for tissue contraction.J Cell Biol. 2016 Aug 29;214(5):495-8. doi: 10.1083/jcb.201608017. Epub 2016 Aug 22. J Cell Biol. 2016. PMID: 27551059 Free PMC article.
-
Regulation of epithelial polarity by the E3 ubiquitin ligase Neuralized and the Bearded inhibitors in Drosophila.Nat Cell Biol. 2012 Apr 15;14(5):467-76. doi: 10.1038/ncb2481. Nat Cell Biol. 2012. PMID: 22504274
References
-
- Lecuit T, Lenne PF. Cell surface mechanics and the control of cell shape, tissue patterns and morphogenesis. Nat Rev Mol Cell Biol. 2007;8:633–44. - PubMed
-
- Leptin M. Gastrulation movements: the logic and the nuts and bolts. Dev Cell. 2005;8:305–20. - PubMed
-
- Alberts B, et al. Molecular Biology of the Cell. Garland Science; New York, NY: 2002.
-
- Baker PC, Schroeder TE. Cytoplasmic filaments and morphogenetic movement in the amphibian neural tube. Dev Biol. 1967;15:432–50. - PubMed
-
- Burnside B. Microtubules and microfilaments in newt neuralation. Dev Biol. 1971;26:416–41. - PubMed
Publication types
MeSH terms
Substances
Grants and funding
LinkOut - more resources
Full Text Sources
Other Literature Sources
Molecular Biology Databases
Research Materials
Miscellaneous

