. 2008 Dec;67(12):1149-58.
doi: 10.1097/NEN.0b013e31818e5e99.

Targeted overexpression of human alpha-synuclein triggers microglial activation and an adaptive immune response in a mouse model of Parkinson disease

Affiliations

Targeted overexpression of human alpha-synuclein triggers microglial activation and an adaptive immune response in a mouse model of Parkinson disease

Shaji Theodore et al. J Neuropathol Exp Neurol. 2008 Dec.

Abstract

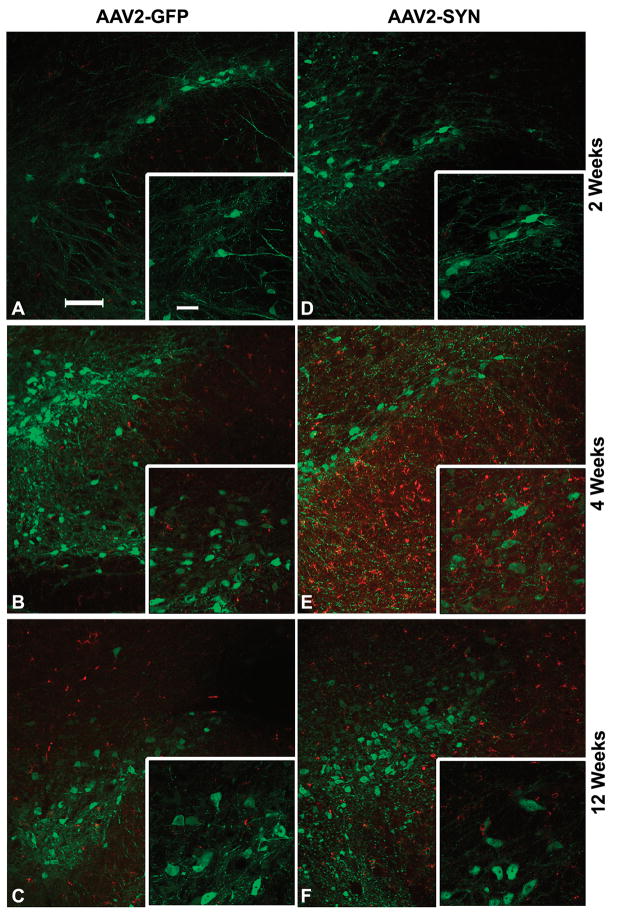
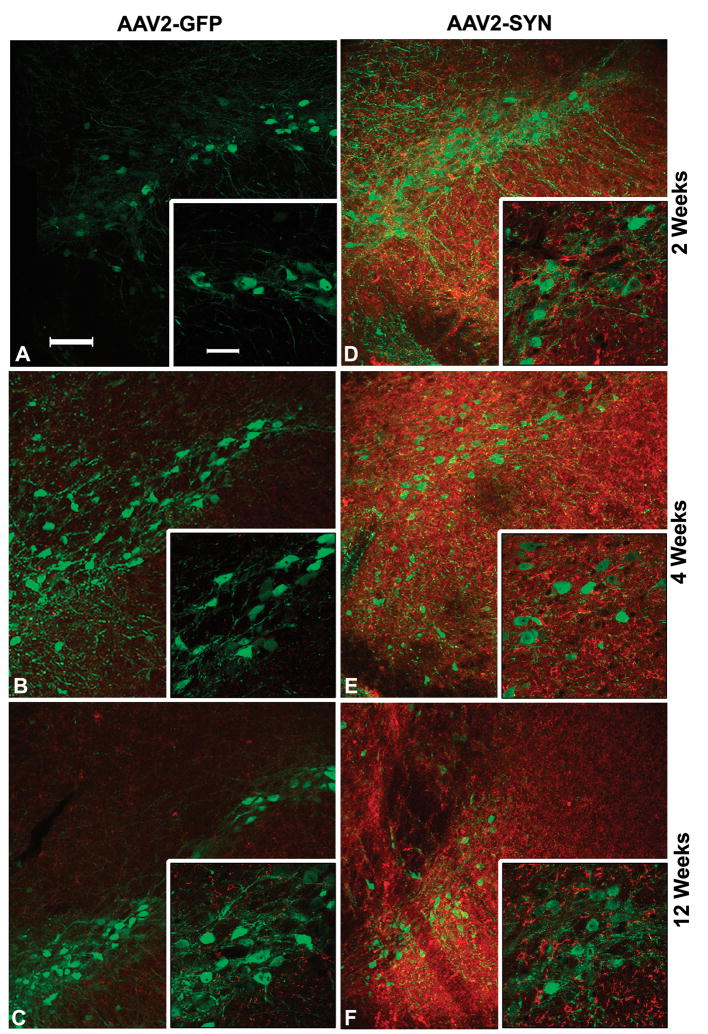
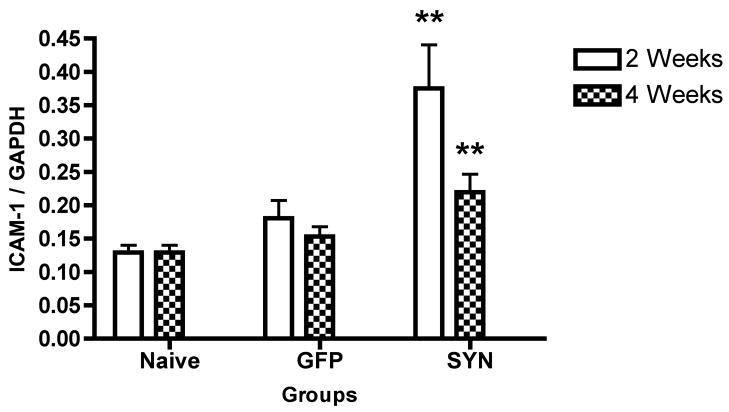
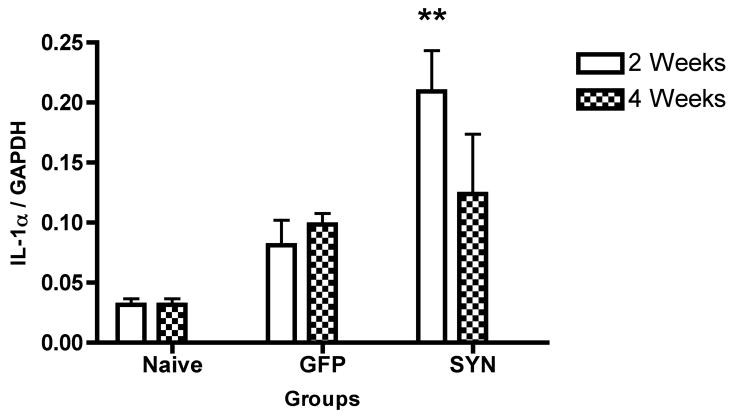
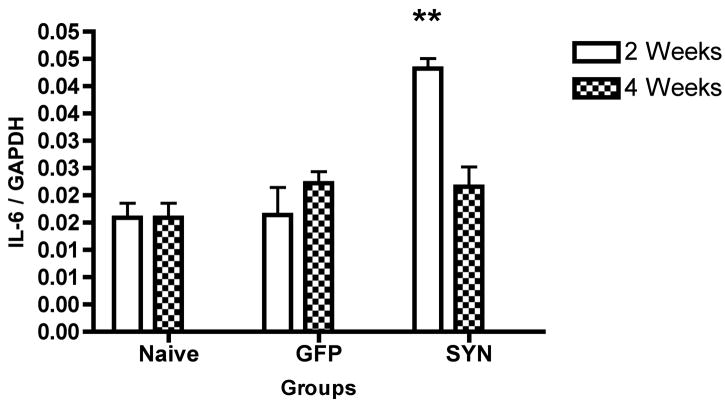
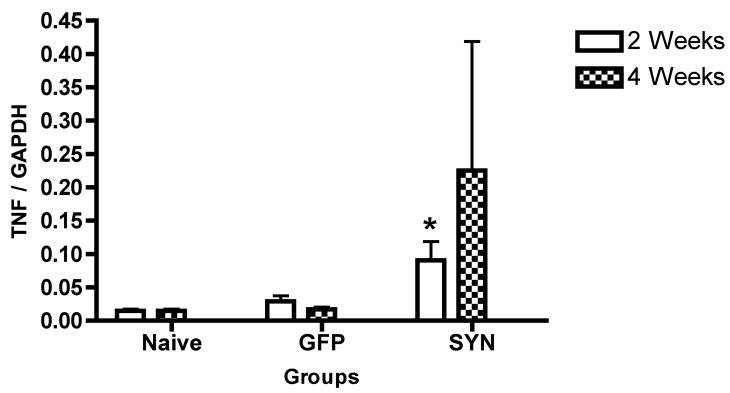
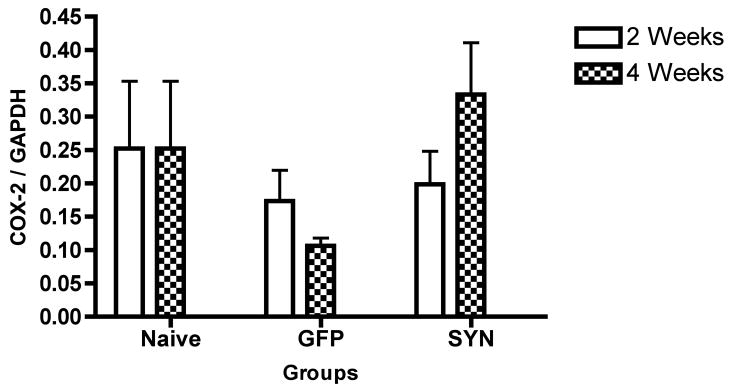
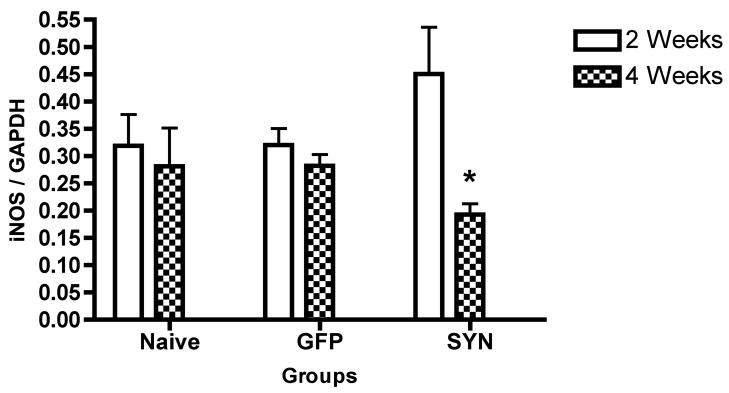
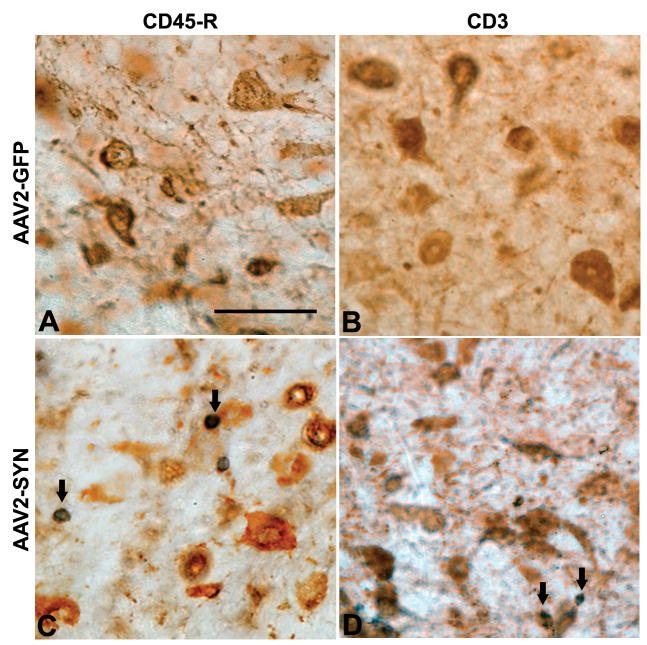
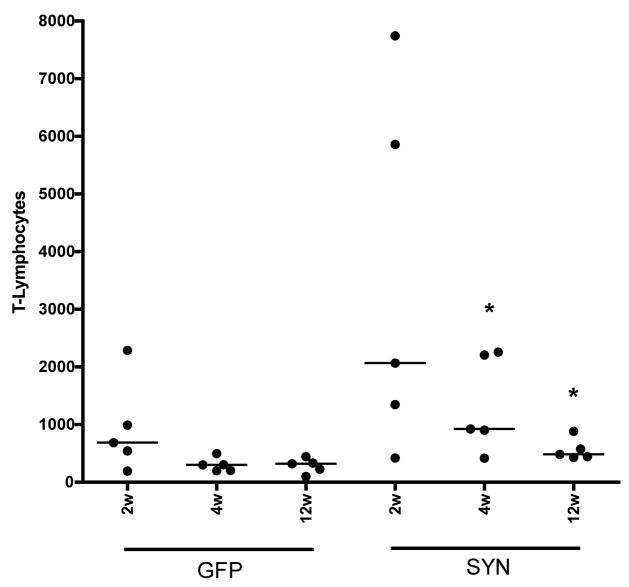
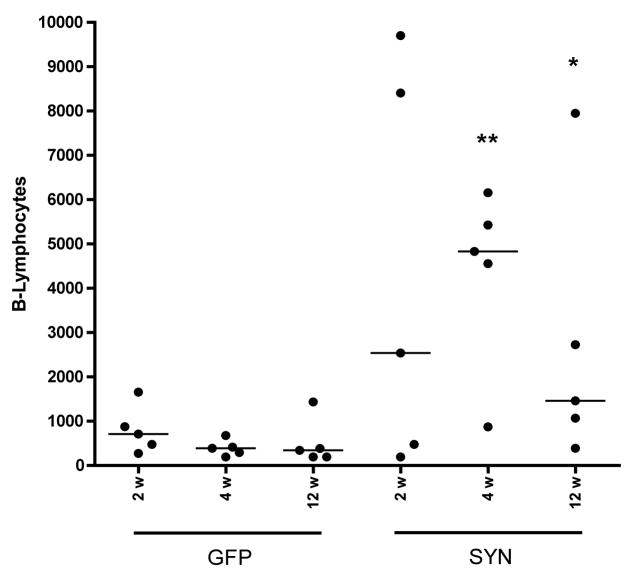
Microglial activation and adaptive immunity have been implicated in the neurodegenerative processes in Parkinson disease. It has been proposed that these responses may be triggered by modified forms of alpha-synuclein (alpha-SYN), particularly nitrated species, which are released as a consequence of dopaminergic neurodegeneration. To examine the relationship between alpha-SYN, microglial activation, and adaptive immunity, we used a mouse model of Parkinson disease in which human alpha-SYN is overexpressed by a recombinant adeno-associated virus vector, serotype 2 (AAV2-SYN); this overexpression leads to slow degeneration of dopaminergic neurons. Microglial activation and components of the adaptive immune response were assessed using immunohistochemistry; quantitative polymerase chain reaction was used to examine cytokine expression. Four weeks after injection, there was a marked increase in CD68-positive microglia and greater infiltration of B and T lymphocytes in the substantia nigra pars compacta of the AAV2-SYN group than in controls. At 12 weeks, CD68 staining declined, but B- and T-cell infiltration persisted. Expression of proinflammatory cytokines was enhanced, whereas markers of alternative activation (i.e. arginase I and interleukins 4 and 13) were not altered. Increased immunoreactivity for mouse immunoglobulin was detected at all time points in the AAV2-SYN animals. These data show that overexpression of alpha-SYN alone, in the absence of overt neurodegeneration, is sufficient to trigger neuroinflammation with both microglial activation and stimulation of adaptive immunity.


Figures

Figure 1
Figure 1
Effect of overexpression of human αSYN on CD68 immunoreactivity in the mouse SN. AAV2-SYN and AAV2-GFP (control) mice were injected into the right SN and the tissue was processed for CD68 staining using a rat monoclonal antibody against mouse CD68 at 2, 4 and 12 weeks post-injection. AAV2-SYN-injected SN displayed increased staining for CD68 (red) in close proximity to αSYN expressing neurons (green) at 4 weeks compared to controls; at 2 and 12 weeks there was less CD68 staining. Panels A–C are from the AAV2-GFP group at 2, 4 and 12 weeks respectively; panels D–F are from the AAV2-SYN group at 2, 4 and 12 weeks respectively. Insets in all sections show high magnification images of the same sections. Scale bar, 100 μm for the low-magnification images and 40 μm for the inset.
Figure 2
Figure 2
Effect of overexpression of human αSYN on IgG immunostaining in the mouse SN. AAV2-SYN or AAV2-GFP (control) mice were injected into the right SN and at 2, 4, and 12 weeks post-injection the tissue was processed for IgG staining using a goat antibody against mouse IgG. Compared to AAV2-GFP-injected tissues (A–C), AAV2-SYN-injected SN (D–F) display intense staining for IgG (red) close to the αSYN-expressing neurons (green) at each time point. IgG immunostaining is particularly intense on cells near the SN neurons. Panels A–C are from the AAV2-GFP group at 2, 4 and 12 weeks, respectively; Panels D–F are from the AAV2-SYN group at 2, 4 and 12 weeks, respectively. Insets in all sections show high magnification images of the same sections. Scale bar, 100 μm for the low-magnification images and 40 μm for the inset.
Figure 3
Figure 3
Effects of AAV2-SYN on the expression levels of neuroinflammatory markers in the SN. Compared to the naïve control group, the AAV2-GFP group did not have significant change in any marker expression. Compared to the AAV2-GFP group, there were significant increases in the levels of ICAM-1 (A), IL-1α (B), IL-6 (C) and TNF (D) at 2 weeks post-treatment in the AAV2-SYN group. A difference was also present for ICAM-1 at 4 weeks, whereas no significant differences for the other markers between the groups were observed at this time point. COX-2 levels did not differ between the two groups at either time point (E). iNOS expression was decreased significantly in the AAV2-SYN group compared to the naïve control group at 4 weeks (F). *, p < 0.05 and **, p < 0.01, AAV2-SYN versus AAV2-GFP for all markers except iNOS; for iNOS, *, p < 0.05, naïve control versus AAV2-SYN. One-Way ANOVA with Fisher PLSD post-hoc test, n = 6/group.
Figure 3
Figure 3
Effects of AAV2-SYN on the expression levels of neuroinflammatory markers in the SN. Compared to the naïve control group, the AAV2-GFP group did not have significant change in any marker expression. Compared to the AAV2-GFP group, there were significant increases in the levels of ICAM-1 (A), IL-1α (B), IL-6 (C) and TNF (D) at 2 weeks post-treatment in the AAV2-SYN group. A difference was also present for ICAM-1 at 4 weeks, whereas no significant differences for the other markers between the groups were observed at this time point. COX-2 levels did not differ between the two groups at either time point (E). iNOS expression was decreased significantly in the AAV2-SYN group compared to the naïve control group at 4 weeks (F). *, p < 0.05 and **, p < 0.01, AAV2-SYN versus AAV2-GFP for all markers except iNOS; for iNOS, *, p < 0.05, naïve control versus AAV2-SYN. One-Way ANOVA with Fisher PLSD post-hoc test, n = 6/group.
Figure 4
Figure 4
Infiltration of lymphocytes into the mouse SN in response to AAV2-SYN. Infiltration of B and T lymphocytes into the SN was examined using antibodies against the markers CD45R and CD3, respectively. Representative images from AAV2-GFP treated (A, B) and AAV2-SYN treated (C, D) mice at the 12 weeks time point show B and T lymphocyte infiltration in the SN. Solid arrows indicate B lymphocytes (C) and T lymphocytes (D) in the SN, close to human αSYN-expressing neurons (brown). Scale bar: 100 μm.
Figure 5
Figure 5
Stereological estimation of T and B lymphocyte infiltration in the SN of AAV2-SYN and AAV2-GFP injected mice. Unbiased stereological estimates of T lymphocytes (A) and B lymphocytes (B) are shown. Compared to the AAV2-GFP group, the AAV2-SYN-treated group showed a trend towards increased infiltration of both B and T cells in the SN at 2 weeks. At 4 and 12 weeks, B and T lymphocyte infiltration was significantly elevated in the AAV2-SYN group compared to the AAV2-GFP group. T lymphocytes: *, p < 0.05, AAV2-SYN, 1342.78 ± 418.59 versus AAV2-GFP, 301.35 ± 60.44 at 4 weeks and *, p < 0.05, AAV2-SYN, 564.71 ± 94.39 versus AAV2-GFP, 285.79 ± 63.85 at 12 weeks; Wilcoxon Sign-rank test, n=5/group. B lymphocytes: **, p < 0.01, AAV2-SYN, 4367.6 ± 1024.39 versus AAV2-GFP, 393.42 ± 90.57 at 4 weeks and *, p < 0.05, AAV2-SYN, 2718.98 ± 1522.31 versus AAV2-GFP, 510.56 ± 261.79 at 12 weeks; Wilcoxon Sign-rank test, n = 5/group.
Figure 5
Figure 5
Stereological estimation of T and B lymphocyte infiltration in the SN of AAV2-SYN and AAV2-GFP injected mice. Unbiased stereological estimates of T lymphocytes (A) and B lymphocytes (B) are shown. Compared to the AAV2-GFP group, the AAV2-SYN-treated group showed a trend towards increased infiltration of both B and T cells in the SN at 2 weeks. At 4 and 12 weeks, B and T lymphocyte infiltration was significantly elevated in the AAV2-SYN group compared to the AAV2-GFP group. T lymphocytes: *, p < 0.05, AAV2-SYN, 1342.78 ± 418.59 versus AAV2-GFP, 301.35 ± 60.44 at 4 weeks and *, p < 0.05, AAV2-SYN, 564.71 ± 94.39 versus AAV2-GFP, 285.79 ± 63.85 at 12 weeks; Wilcoxon Sign-rank test, n=5/group. B lymphocytes: **, p < 0.01, AAV2-SYN, 4367.6 ± 1024.39 versus AAV2-GFP, 393.42 ± 90.57 at 4 weeks and *, p < 0.05, AAV2-SYN, 2718.98 ± 1522.31 versus AAV2-GFP, 510.56 ± 261.79 at 12 weeks; Wilcoxon Sign-rank test, n = 5/group.

Similar articles

Cited by

References

    1. McGeer PL, Itagaki S, Boyes BE, McGeer EG. Reactive microglia are positive for HLA-DR in the substantia nigra of Parkinson’s and Alzheimer’s disease brains. Neurology. 1988;38:1285–91. - PubMed
    1. McGeer PL, Schwab C, Parent A, Doudet D. Presence of reactive microglia in monkey substantia nigra years after 1-methyl-4-phenyl-1,2,3,6-tetrahydropyridine administration. Ann Neurol. 2003;54:599–604. - PubMed
    1. Sherer TB, Betarbet R, Kim JH, Greenamyre JT. Selective microglial activation in the rat rotenone model of Parkinson’s disease. Neurosci Lett. 2003;341:87–90. - PubMed
    1. Kurkowska-Jastrzebska I, Wronska A, Kohutnicka M, Czlonkowski A, Czlonkowska A. The inflammatory reaction following 1-methyl-4-phenyl-1,2,3, 6-tetrahydropyridine intoxication in mouse. Exp Neurol. 1999;156:50–61. - PubMed
    1. Reynolds AD, Banerjee R, Liu J, Gendelman HE, Mosley RL. Neuroprotective activities of CD4+CD25+ regulatory T cells in an animal model of Parkinson’s disease. J Leukoc Biol. 2007;82:1083–94. - PubMed

Publication types

MeSH terms