. 2009 Jan 20;383(2):348-61.
doi: 10.1016/j.virol.2008.09.030. Epub 2008 Nov 17.

Chimeric human parainfluenza virus bearing the Ebola virus glycoprotein as the sole surface protein is immunogenic and highly protective against Ebola virus challenge

Affiliations

Chimeric human parainfluenza virus bearing the Ebola virus glycoprotein as the sole surface protein is immunogenic and highly protective against Ebola virus challenge

Alexander Bukreyev et al. Virology. .

Abstract

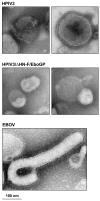
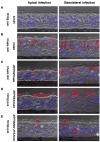
We generated a new live-attenuated vaccine against Ebola virus (EBOV) based on a chimeric virus HPIV3/DeltaF-HN/EboGP that contains the EBOV glycoprotein (GP) as the sole transmembrane envelope protein combined with the internal proteins of human parainfluenza virus type 3 (HPIV3). Electron microscopy analysis of the virus particles showed that they have an envelope and surface spikes resembling those of EBOV and a particle size and shape resembling those of HPIV3. When HPIV3/DeltaF-HN/EboGP was inoculated via apical surface of an in vitro model of human ciliated airway epithelium, the virus was released from the apical surface; when applied to basolateral surface, the virus infected basolateral cells but did not spread through the tissue. Following intranasal (IN) inoculation of guinea pigs, scattered infected cells were detected in the lungs by immunohistochemistry, but infectious HPIV3/DeltaF-HN/EboGP could not be recovered from the lungs, blood, or other tissues. Despite the attenuation, the virus was highly immunogenic, and a single IN dose completely protected the animals against a highly lethal intraperitoneal challenge of guinea pig-adapted EBOV.


Figures
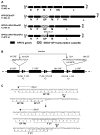
Fig. 1
Fig. 1
Construction of HPIV3/ΔF-HN/EboGP, expressing the complete EBOV GP, and HPIV3/ΔF-HN/EboGPct, expressing EBOV GP bearing the cytoplasmic tail (CT) of the HPIV3 F protein. A. Genome maps of, in descending order: complete infectious HPIV3; HPIV3/EboGP, which was previously derived (Bukreyev et al., 2007; Bukreyev et al., 2006) from HPIV3 by insertion, between the HPIV3 P and M genes, of a transcription cassette expressing the complete EBOV GP; HPIV3/ΔF-HN/EboGP, which was derived from HPIV3/EboGP by deleting the HPIV3 F and HN genes; and HPIV3/ΔF-HN/EboGPct, which was derived from HPIV3/ΔF-HN/EboGP by replacing the CT of EBOV GP with that of HPIV3 F. The genome nucleotide lengths are shown to the left. B. Deletion of HPIV3 F and HN genes. The region of the HPIV3/EboGP genome spanning the M, F, HN, and L genes is shown; ORFs are indicated as filled rectangles that are flanked by horizontal lines indicating noncoding gene regions; gene junctions are indicated as a filled bar denoting a gene-end (GE) signal, a short horizontal line denoting an intergenic (IG) trinucleotide, and a filled arrowhead denoting a gene-start (GS) signal. The sequences at the deletion points are expanded above the diagram. A StuI site that was introduced 6–11 nucleotides upstream of the HN GE signal is italicized. The deletion begins at the fourth nucleotide following the M ORF and ends at the above-mentioned StuI site. C. Replacement of the CT of EBOV GP with that of HPIV3 F. Top: the downstream part of EBOV GP is shown with the transmembrane domain (TM) and the CT indicated by dashed and solid lines, respectively. Bottom: modified chimeric GP in which the GP CT has been replaced with the much longer CT from HPIV3 F. The stop codon is depicted with an asterisk. BfuAI and MluI recognition sequences present in the EBOV GP transcription cassette and used for the replacement are italicized with their cleavage sites indicated with arrowheads (note that BfuAI cuts outside of, and in this case upstream of, its recognition sequence).
Fig. 2
Fig. 2
Electron micrographs of negative-stained particles of HPIV3, HPIV3/ΔF-HN/EboGP, and EBOV. Note that the envelope of HPIV3/ΔF-HN/EboGP is thinner than that of HPIV3 and contains spikes that resemble those of EBOV rather than HPIV3. Conversely, the shape of the HPIV3/ΔF-HN/EboGP particle resembles that of HPIV3 rather than EBOV. The EBOV image was kindly provided by C. Humphrey and A. Sanchez (Centers for Disease Control and Prevention, Atlanta, GA).
Fig. 3
Fig. 3
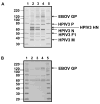
Analysis of purified virions of HPIV3, HPIV3/EboGP, and HPIV3/ΔF-HN/EboGP by gel electrophoresis in conjunction with silver staining (A) or Western blotting using a guinea pig antiserum raised against a DNA vaccine expressing EBOV GP (B). Lanes: 1 and 5, MagicMark XP (Invitrogen) with the corresponding molecular weights indicated to the left; 2, HPIV3; 3, HPIV3/EboGP; 4, HPIV3/ΔF-HN/EboGP. The HPIV3 P, HN, N, F1 and M bands are identified based on published profiles (Storey, Dimock, and Kang, 1984; Wechsler et al., 1985) and the position of EBOV GP is indicated.
Fig. 4
Fig. 4
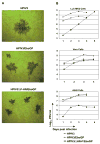
Replication of HPIV3/ΔF-HN/EboGP in cell monolayers. A. Plaque formation in LLC-MK2 cells by HPIV3, HPIV3/EboGP and HPIV3/ΔF-HN/EboGP. The cells were incubated under methycellulose for 6 days at 32°C, fixed, and analyzed immunostaining with rabbit antiserum rraised against purified HPIV3 virions (HPIV3 panel) or purified inactivated EBOV virions (HPIV3/EboGP and HPIV3/ΔF-HN/EboGP panels). B. Growth kinetics of HPIV3, HPIV3/EboGP and HPIV3/ΔF-HN/EboGP in LLC-MK2, Vero and A549 cells. Cells were infected at an MOI of 3 PFU/cell during a 2-h adsorption period, washed three times, and incubated at 32°C. Aliquots of the overlying medium were taken on days 1, 2, 3, 4, and 6 and replaced with fresh medium. Viral titers in the aliquots were determined by plaque titration in LLC-MK2 cells. Mean values ± SE, based on three monolayers per virus, are shown. The limit of detection is 1.7 log10 PFU/ml, with the exception of day 1, for which it was 0.7 log10 PFU/ml. Note that for many time points, error bars cannot be seen due to the low variability. In LLC-MK2 and A549 cells infected with HPIV3 and HPIV3/EboGP, the monolayers were completely destroyed by day 6, and therefore medium aliquots were not collected. Data from one of the two independent experiments performed are shown. Growth kinetics of HPIV3 and HPIV3/EboGP in LLC-MK2 and Vero cells using low MOI (0.001 PFU) were determined in a previous study (Bukreyev et al., 2006).
Fig. 5
Fig. 5
Infection of an in vitro model of human airway epithelium (HAE) with HPIV3 (rows A and B), HPIV3/EboGP (rows C and D), and HPIV3/ΔF-HN/EboGP (row E): selected representative cross-sectional images. HAE were inoculated from either the apical (left column) or basolateral surface (right column; note that the method used for basolateral inoculation exposed both surfaces to infection, see the text), and were fixed and analyzed by immunostaining on day 2 (HPIV3/EboGP) or day 4 (HPIV3, HPIV3/ΔF-HN/EboGP). Viral antigen was detected with rabbit antiserum raised against purified HPIV3 virions (rows B and C) or purified, inactivated EBOV virions (rows A, D and E) as the first antibody followed by a labeled second antibody (red), and the nuclei were stained blue with DAPI. Treatment of HPIV3-infected HAE with the EBOV-specific antibodies did not result in antigen detection, as expected (row A). Specificity of stainings was also established in preliminary experiments (data not shown).
Fig. 6
Fig. 6
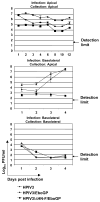
Growth kinetics of HPIV3, HPIV3/EboGP and HPIV3/ΔF-HN/EboGP on HAE. Triplicate HAE cultures were inoculated with viruses at an MOI of 2 PFU via the apical or basolateral and apical surfaces, viral supernatants from the apical or basolateral compartments were harvested, and viral titers were determined by plaque titration in LLC-MK2 cells. Means represent three samples per group ± SE. For the samples below the limit of detection, which was 1.7 log10 PFU/ml, the value two-fold below the limit (1.4 log10 PFU/ml) was assigned for calculation of the means.
Fig. 7
Fig. 7
Replication of HPIV3, HPIV3/EboGP and HPIV3/ΔF-HN/EboGP in the lungs of guinea pigs: virus titers in the lungs harvested on days 2 and 4 after IN infection at a dose of 4X10⁵ PFU per animal. Mean values ± SE are based on five (HPIV3) or six (HPIV3/EboGP, HPIV3/ΔF-HN/EboGP) animals per time point. No infectious HPIV3/ΔF-HN/EboGP was recovered at either time point (level of detection 1.47 log10 PFU/g).
Fig. 8
Fig. 8
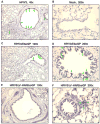
Immunohistochemical analysis of viral antigen distribution in guinea pig lungs on day 2 after IN infection with 4x10⁵ PFU of HPIV3 (A), HPIV3/EboGP (C, D), HPIV3/ΔF-HN/EboGP (E, F), or mock infection (B). A, C, D, Viral antigen detected in bronchial epithelium. F, A focus of positive staining present in alveoli; an adjacent bronchiole is negative. E, Lack of viral antigen in a bronchus. Viral antigen is stained brown against a background of hematoxylin counterstain; cells positive for the antigen are shown with green arrows.
Fig. 9
Fig. 9
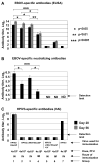
Serum antibody responses in guinea pigs 28 (filled bars) and 56 (cross-hatched bars) days following inoculation with 4x10⁵ PFU of HPIV3/EboGP given IN (group 1), 4x10⁵ or 4x10⁶ PFU of HPIV3/ΔF-HN/EboGP given IN (groups 2 and 3), 4x10⁶ PFU of HPIV3/ΔF-HN/EboGP given IM (group 4), the equivalent of 4x10⁶ PFU of UV-inactivated HPIV3/ΔF-HN/EboGP given IN (group 5) or IM (group 6), and 4x10⁶ PFU of HPIV3 given IN (group 7). A, EBOV-specific antibody titers, determined by ELISA against inactivated EBOV particles. B, EBOV-specific 60% plaque reduction titers (day 28 only); 1 of 6 animals in group 2 and 3 of 6 animals in group 4 lacked detectable neutralizing antibodies and were assigned values of 1:10 for the purpose of calculation. C, HPIV3-specific antibody titers, determined by HAI; the samples from groups 2–6 were below the limit of detection and were assigned values of 1:20 for the purpose of calculation. Results from all three assays are expressed as mean values ± SE based on six animals per groups 1–4, four animals per groups 5 and 6, and two animals per group 7 (this last group was from a separate experiment that was included for comparison; mean with no SE). The differences between the groups 1 and 3 in the levels of the EBOV-specific ELISA (A) and neutralizing (B) antibody responses are not significant with the exception of the ELISA titers on day 56, for which the difference is significant (p<0.05). ND, not done. A second experiment with additional animals yielded similar results (not shown). Statistical significances of differences between the values for groups 1–4 are shown in panel A (day 28 only) and panel B.
Fig. 10
Fig. 10
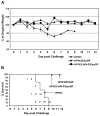
Challenge with EBOV: guinea pigs were immunized IN with 4x10⁵ PFU of HPIV3 (4 animals), 4x10⁵ PFU of HPIV3/EboGP (4 animals), or 4x10⁶ PFU of HPIV3/ΔF-HN/EboGP (6 animals), and challenged 25 days later with 1,000 PFU of EBOV by the IP route. A. Percent change in body weight following EBOV challenge. Daily mean weights ± SE are shown expressed as a percentage of the weight on day 0. When one or more animals in a group died, the SE was calculated based on the remaining live animals, with a minimum of 3 animals per group. B. Kaplan-Maier survival curves and clinical disease scores. All of the animals immunized with HPIV3/ΔF-HN/EboGP or HPIV3/EboGP survived, while all of the HPIV3-immunized (control) animals died. Disease signs were observed only in the control group and were scored daily for each of the four animals as follows: 1, ruffled fur, reduced activity, loss of body conditions; 2, labored breathing, hunched posture, bleeding, marked lethargy; 2+, same as 2, but extremely severe. Each row represents the daily scores for one of the four control animals in that group, ending with a vertical line on the day of death. One animal shown in the bottom was euthanized on day 9 due to severity of the disease.

Similar articles

Cited by

References

    1. Barouch DH, Pau MG, Custers JH, Koudstaal W, Kostense S, Havenga MJ, Truitt DM, Sumida SM, Kishko MG, Arthur JC, Korioth-Schmitz B, Newberg MH, Gorgone DA, Lifton MA, Panicali DL, Nabel GJ, Letvin NL, Goudsmit J. Immunogenicity of recombinant adenovirus serotype 35 vaccine in the presence of pre-existing anti-Ad5 immunity. J Immunol. 2004;172(10):6290–7. - PubMed
    1. Bukreyev A, Rollin PE, Tate MK, Yang L, Zaki SR, Shieh WJ, Murphy BR, Collins PL, Sanchez A. Successful topical respiratory tract immunization of primates against Ebola virus. J Virol. 2007;81(12):6379–88. - PMC - PubMed
    1. Bukreyev A, Yang L, Zaki SR, Shieh WJ, Rollin PE, Murphy BR, Collins PL, Sanchez A. A Single Intranasal Inoculation with a Paramyxovirus-Vectored Vaccine Protects Guinea Pigs against a Lethal-Dose Ebola Virus Challenge. J Virol. 2006;80(5):2267–79. - PMC - PubMed
    1. Casimiro DR, Chen L, Fu TM, Evans RK, Caulfield MJ, Davies ME, Tang A, Chen M, Huang L, Harris V, Freed DC, Wilson KA, Dubey S, Zhu DM, Nawrocki D, Mach H, Troutman R, Isopi L, Williams D, Hurni W, Xu Z, Smith JG, Wang S, Liu X, Guan L, Long R, Trigona W, Heidecker GJ, Perry HC, Persaud N, Toner TJ, Su Q, Liang X, Youil R, Chastain M, Bett AJ, Volkin DB, Emini EA, Shiver JW. Comparative immunogenicity in rhesus monkeys of DNA plasmid, recombinant vaccinia virus, and replication-defective adenovirus vectors expressing a human immunodeficiency virus type 1 gag gene. J Virol. 2003;77(11):6305–13. - PMC - PubMed
    1. Collins PL, Bukreyev A. Advances in the development of vaccines against Marburg and Ebola viruses. Future Virology. 2007;2(6):537–541. - PMC - PubMed

Publication types

MeSH terms