Batf3 deficiency reveals a critical role for CD8alpha+ dendritic cells in cytotoxic T cell immunity
- PMID: 19008445
- PMCID: PMC2756611
- DOI: 10.1126/science.1164206
Batf3 deficiency reveals a critical role for CD8alpha+ dendritic cells in cytotoxic T cell immunity
Abstract
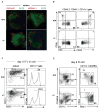
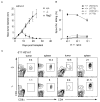
Although in vitro observations suggest that cross-presentation of antigens is mediated primarily by CD8alpha+ dendritic cells, in vivo analysis has been hampered by the lack of systems that selectively eliminate this cell lineage. We show that deletion of the transcription factor Batf3 ablated development of CD8alpha+ dendritic cells, allowing us to examine their role in immunity in vivo. Dendritic cells from Batf3-/- mice were defective in cross-presentation, and Batf3-/- mice lacked virus-specific CD8+ T cell responses to West Nile virus. Importantly, rejection of highly immunogenic syngeneic tumors was impaired in Batf3-/- mice. These results suggest an important role for CD8alpha+ dendritic cells and cross-presentation in responses to viruses and in tumor rejection.
Figures


Similar articles
-
Batf3-dependent CD103+ dendritic cells are major producers of IL-12 that drive local Th1 immunity against Leishmania major infection in mice.Eur J Immunol. 2015 Jan;45(1):119-29. doi: 10.1002/eji.201444651. Epub 2014 Nov 28. Eur J Immunol. 2015. PMID: 25312824 Free PMC article.
-
CD8α+ DCs can be induced in the absence of transcription factors Id2, Nfil3, and Batf3.Blood. 2013 Feb 28;121(9):1574-83. doi: 10.1182/blood-2012-07-445650. Epub 2013 Jan 7. Blood. 2013. PMID: 23297132
-
Ablation of CD8α(+) dendritic cell mediated cross-presentation does not impact atherosclerosis in hyperlipidemic mice.Sci Rep. 2015 Oct 21;5:15414. doi: 10.1038/srep15414. Sci Rep. 2015. PMID: 26486587 Free PMC article.
-
Concise review: The heterogenous roles of BATF3 in cancer oncogenesis and dendritic cells and T cells differentiation and function considering the importance of BATF3-dependent dendritic cells.Immunogenetics. 2024 Apr;76(2):75-91. doi: 10.1007/s00251-024-01335-x. Epub 2024 Feb 15. Immunogenetics. 2024. PMID: 38358555 Review.
-
The role of CD4 T cell help for CD8 CTL activation.Biochem Biophys Res Commun. 2009 Jul 10;384(4):405-8. doi: 10.1016/j.bbrc.2009.04.134. Epub 2009 May 3. Biochem Biophys Res Commun. 2009. PMID: 19410556 Review.
Cited by
-
Selective inhibition of mTORC1 in tumor vessels increases antitumor immunity.JCI Insight. 2020 Aug 6;5(15):e139237. doi: 10.1172/jci.insight.139237. JCI Insight. 2020. PMID: 32759497 Free PMC article.
-
Host-derived CD8+ dendritic cells are required for induction of optimal graft-versus-tumor responses after experimental allogeneic bone marrow transplantation.Blood. 2013 May 16;121(20):4231-41. doi: 10.1182/blood-2012-05-432872. Epub 2013 Mar 21. Blood. 2013. PMID: 23520337 Free PMC article.
-
Viral Respiratory Pathogens and Lung Injury.Clin Microbiol Rev. 2021 Mar 31;34(3):e00103-20. doi: 10.1128/CMR.00103-20. Print 2021 Jun 16. Clin Microbiol Rev. 2021. PMID: 33789928 Free PMC article. Review.
-
From the draining lymph node to the liver: the induction and effector mechanisms of malaria-specific CD8+ T cells.Semin Immunopathol. 2015 May;37(3):211-20. doi: 10.1007/s00281-015-0479-3. Epub 2015 Apr 28. Semin Immunopathol. 2015. PMID: 25917387 Free PMC article. Review.
-
Peptide-MHC-I from Endogenous Antigen Outnumber Those from Exogenous Antigen, Irrespective of APC Phenotype or Activation.PLoS Pathog. 2015 Jun 24;11(6):e1004941. doi: 10.1371/journal.ppat.1004941. eCollection 2015 Jun. PLoS Pathog. 2015. PMID: 26107264 Free PMC article.
References
Publication types
MeSH terms
Substances
Grants and funding
LinkOut - more resources
Full Text Sources
Other Literature Sources
Molecular Biology Databases
Research Materials

