Computing the stability diagram of the Trp-cage miniprotein
- PMID: 19004791
- PMCID: PMC2582582
- DOI: 10.1073/pnas.0804775105
Computing the stability diagram of the Trp-cage miniprotein
Abstract
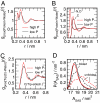
We report molecular dynamics simulations of the equilibrium folding/unfolding thermodynamics of an all-atom model of the Trp-cage miniprotein in explicit solvent. Simulations are used to sample the folding/unfolding free energy difference and its derivatives along 2 isochores. We model the DeltaG(u)(P,T) landscape using the simulation data and propose a stability diagram model for Trp-cage. We find the proposed diagram to exhibit features similar to globular proteins with increasing hydrostatic pressure destabilizing the native fold. The observed energy differences DeltaE(u) are roughly linearly temperature-dependent and approach DeltaE(u) = 0 with decreasing temperature, suggesting that the system approached the region of cold denaturation. In the low-temperature denatured state, the native helical secondary structure elements are largely preserved, whereas the protein conformation changes to an "open-clamp" configuration. A tighter packing of water around nonpolar sites, accompanied by an increasing solvent-accessible surface area of the unfolded ensemble, seems to stabilize the unfolded state at elevated pressures.
Conflict of interest statement
The authors declare no conflict of interest.
Figures


Similar articles
-
Microsecond simulations of the folding/unfolding thermodynamics of the Trp-cage miniprotein.Proteins. 2010 Jun;78(8):1889-99. doi: 10.1002/prot.22702. Proteins. 2010. PMID: 20408169 Free PMC article.
-
Replica exchange simulation of reversible folding/unfolding of the Trp-cage miniprotein in explicit solvent: on the structure and possible role of internal water.J Struct Biol. 2007 Mar;157(3):524-33. doi: 10.1016/j.jsb.2006.10.031. Epub 2006 Nov 26. J Struct Biol. 2007. PMID: 17293125
-
Influence of water-protein hydrogen bonding on the stability of Trp-cage miniprotein. A comparison between the TIP3P and TIP4P-Ew water models.Phys Chem Chem Phys. 2011 Nov 28;13(44):19840-7. doi: 10.1039/c1cp22110h. Epub 2011 Aug 15. Phys Chem Chem Phys. 2011. PMID: 21845272
-
Folding and unfolding thermodynamics of the TC10b Trp-cage miniprotein.Phys Chem Chem Phys. 2014 Feb 21;16(7):2748-57. doi: 10.1039/c3cp54339k. Epub 2014 Jan 3. Phys Chem Chem Phys. 2014. PMID: 24448113
-
Computational investigation of cold denaturation in the Trp-cage miniprotein.Proc Natl Acad Sci U S A. 2016 Aug 9;113(32):8991-6. doi: 10.1073/pnas.1607500113. Epub 2016 Jul 25. Proc Natl Acad Sci U S A. 2016. PMID: 27457961 Free PMC article.
Cited by
-
Improved Generalized Born Solvent Model Parameters for Protein Simulations.J Chem Theory Comput. 2013 Apr 9;9(4):2020-2034. doi: 10.1021/ct3010485. J Chem Theory Comput. 2013. PMID: 25788871 Free PMC article.
-
Conformational sampling of peptides in the presence of protein crowders from AA/CG-multiscale simulations.J Phys Chem B. 2012 Jul 26;116(29):8610-20. doi: 10.1021/jp300129u. Epub 2012 Apr 5. J Phys Chem B. 2012. PMID: 22429139 Free PMC article.
-
Effect of Osmolytes on Conformational Behavior of Intrinsically Disordered Protein α-Synuclein.Biophys J. 2019 Nov 19;117(10):1922-1934. doi: 10.1016/j.bpj.2019.09.046. Epub 2019 Oct 22. Biophys J. 2019. PMID: 31699336 Free PMC article.
-
Circular Permutation of the Trp-cage: Fold Rescue upon Addition of a Hydrophobic Staple.RSC Adv. 2013 Nov 21;2013(43):10.1039/C3RA43674H. doi: 10.1039/C3RA43674H. RSC Adv. 2013. PMID: 24376912 Free PMC article.
-
Topological bio-scaling analysis as a universal measure of protein folding.R Soc Open Sci. 2022 Jul 13;9(7):220160. doi: 10.1098/rsos.220160. eCollection 2022 Jul. R Soc Open Sci. 2022. PMID: 35845855 Free PMC article.
References
-
- Kauzmann W. Some factors in the interpretation of protein denaturation. Adv Protein Chem. 1959;14:1–63. - PubMed
-
- Zipp A, Kauzmann W. Pressure denaturation of metmyoglobin. Biochemistry. 1973;12:4217–4228. - PubMed
-
- Heremans K. High-pressure effects on proteins and other biomolecules. Annu Rev Biophys Biol. 1982;11:1–21. - PubMed
-
- Timasheff SN. The control of protein stability and association by weak interactions with water: How do solvents affect these processes. Annu Rev Biophys Biomol Struct. 1993;22:67–97. - PubMed
-
- Makhatadze GI, Privalov PL. Energetics of protein structure. Adv Protein Chem. 1995;47:307–425. - PubMed
Publication types
MeSH terms
Substances
LinkOut - more resources
Full Text Sources
Other Literature Sources

