

Uniparental disomies, homozygous deletions, amplifications, and target genes in mantle cell lymphoma revealed by integrative high-resolution whole-genome profiling
- PMID: 18984860
- PMCID: PMC2662646
- DOI: 10.1182/blood-2008-07-170183
Uniparental disomies, homozygous deletions, amplifications, and target genes in mantle cell lymphoma revealed by integrative high-resolution whole-genome profiling
Abstract
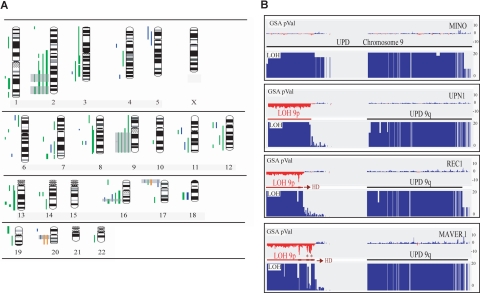
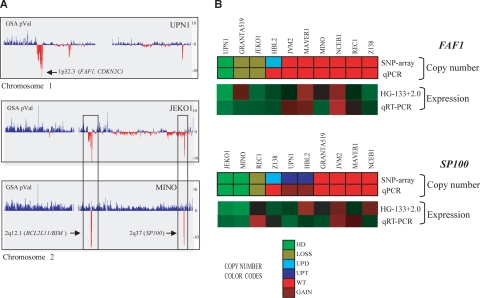
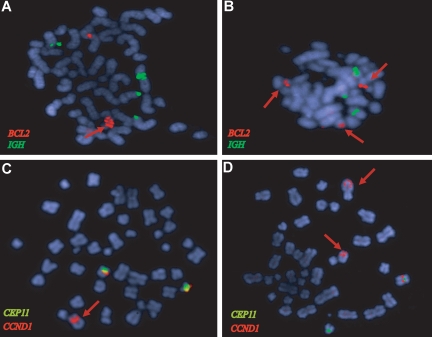
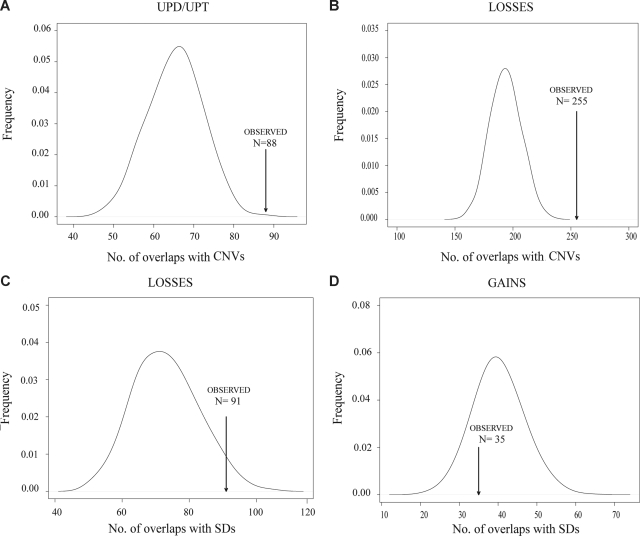
Mantle cell lymphoma (MCL) is genetically characterized by the t(11;14)(q13;q32) translocation and a high number of secondary chromosomal alterations. However, only a limited number of target genes have been identified. We have studied 10 MCL cell lines and 28 primary tumors with a combination of a high-density single-nucleotide polymorphism array and gene expression profiling. We detected highly altered genomes in the majority of the samples with a high number of partial uniparental disomies (UPDs). The UPD at 17p was one of the most common, and it was associated with TP53 gene inactivation. Homozygous deletions targeted 4 known tumor suppressor genes (CDKN2C, BCL2L11, CDKN2A, and RB1) and 6 new genes (FAF1, MAP2, SP100, MOBKL2B, ZNF280A, and PRAME). Gene amplification coupled with overexpression was identified in 35 different regions. The most recurrent amplified regions were 11q13.3-q13.5, 13q31.3, and 18q21.33, which targeted CCND1, C13orf25, and BCL2, respectively. Interestingly, the breakpoints flanking all the genomic alterations, including UPDs, were significantly associated with genomic regions enriched in copy number variants and segmental duplications, suggesting that the recombination at these regions may play a role in the genomic instability of MCL. This integrative genomic analysis has revealed target genes that may be potentially relevant in MCL pathogenesis.
Figures
Similar articles
-
GeneChip analyses point to novel pathogenetic mechanisms in mantle cell lymphoma.Br J Haematol. 2009 Feb;144(3):317-31. doi: 10.1111/j.1365-2141.2008.07443.x. Epub 2008 Nov 7. Br J Haematol. 2009. PMID: 19016712
-
Comprehensive whole genome array CGH profiling of mantle cell lymphoma model genomes.Hum Mol Genet. 2004 Sep 1;13(17):1827-37. doi: 10.1093/hmg/ddh195. Epub 2004 Jun 30. Hum Mol Genet. 2004. PMID: 15229187
-
Identified hidden genomic changes in mantle cell lymphoma using high-resolution single nucleotide polymorphism genomic array.Exp Hematol. 2009 Aug;37(8):937-46. doi: 10.1016/j.exphem.2009.04.012. Epub 2009 May 27. Exp Hematol. 2009. PMID: 19477219 Free PMC article.
-
The consequences of uniparental disomy and copy number neutral loss-of-heterozygosity during human development and cancer.Biol Cell. 2011 Jul;103(7):303-17. doi: 10.1042/BC20110013. Biol Cell. 2011. PMID: 21651501 Review.
-
[Analysis of genomic copy number alterations of malignant lymphomas and its application for diagnosis].Gan To Kagaku Ryoho. 2007 Jul;34(7):975-82. Gan To Kagaku Ryoho. 2007. PMID: 17637530 Review. Japanese.
Cited by
-
Fas-associated factor 1 is a scaffold protein that promotes β-transducin repeat-containing protein (β-TrCP)-mediated β-catenin ubiquitination and degradation.J Biol Chem. 2012 Aug 31;287(36):30701-10. doi: 10.1074/jbc.M112.353524. Epub 2012 Jun 22. J Biol Chem. 2012. PMID: 22730322 Free PMC article.
-
Gata3 restrains B cell proliferation and cooperates with p18INK4c to repress B cell lymphomagenesis.Oncotarget. 2016 Sep 27;7(39):64007-64020. doi: 10.18632/oncotarget.11746. Oncotarget. 2016. PMID: 27588406 Free PMC article.
-
Integrative and comparative genomics analysis of early hepatocellular carcinoma differentiated from liver regeneration in young and old.Mol Cancer. 2010 Jun 12;9:146. doi: 10.1186/1476-4598-9-146. Mol Cancer. 2010. PMID: 20540791 Free PMC article.
-
Pathway discovery in mantle cell lymphoma by integrated analysis of high-resolution gene expression and copy number profiling.Blood. 2010 Aug 12;116(6):953-61. doi: 10.1182/blood-2010-01-263806. Epub 2010 Apr 26. Blood. 2010. PMID: 20421449 Free PMC article.
-
The Difficulties and Ease of Diagnosing Anaplastic Large Cell Lymphomas on Cytology.J Cytol. 2024 Apr-Jun;41(2):59-66. doi: 10.4103/joc.joc_50_23. Epub 2024 Apr 24. J Cytol. 2024. PMID: 38779607 Free PMC article.
References
-
- Jares P, Colomer D, Campo E. Genetic and molecular pathogenesis of mantle cell lymphoma: perspectives for new targeted therapeutics. Nat Rev Cancer. 2007;7:750–762. - PubMed
-
- Hirt C, Schuler F, Dolken L, Schmidt CA, Dolken G. Low prevalence of circulating t(11;14)(q13;q32)-positive cells in the peripheral blood of healthy individuals as detected by real-time quantitative PCR. Blood. 2004;104:904–905. - PubMed
Publication types
MeSH terms
Grants and funding
LinkOut - more resources
Full Text Sources
Other Literature Sources
Research Materials
Miscellaneous
