. 2009 Jan;58(1):174-84.
doi: 10.2337/db08-0862. Epub 2008 Nov 4.

Regulation of calcium-permeable TRPV2 channel by insulin in pancreatic beta-cells

Affiliations

Regulation of calcium-permeable TRPV2 channel by insulin in pancreatic beta-cells

Etsuko Hisanaga et al. Diabetes. 2009 Jan.

Abstract

Objective: Calcium-permeable cation channel TRPV2 is expressed in pancreatic beta-cells. We investigated regulation and function of TRPV2 in beta-cells.

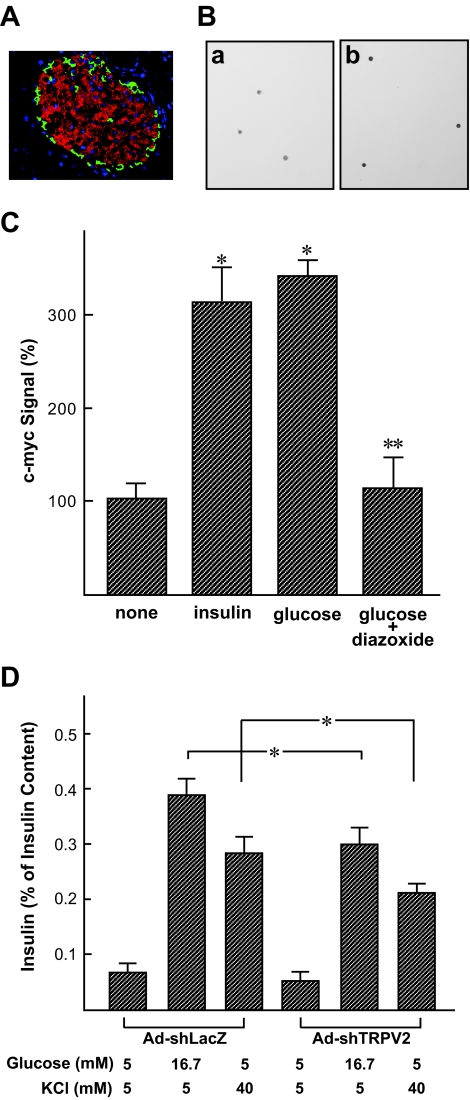
Research design and methods: Translocation of TRPV2 was assessed in MIN6 cells and cultured mouse beta-cells by transfecting TRPV2 fused to green fluorescent protein or TRPV2 containing c-Myc tag in the extracellular domain. Calcium entry was assessed by monitoring fura-2 fluorescence.

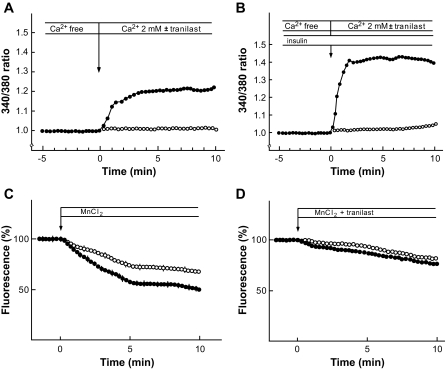
Results: In MIN6 cells, TRPV2 was observed mainly in cytoplasm in an unstimulated condition. Addition of exogenous insulin induced translocation and insertion of TRPV2 to the plasma membrane. Consistent with these observations, insulin increased calcium entry, which was inhibited by tranilast, an inhibitor of TRPV2, or by knockdown of TRPV2 using shRNA. A high concentration of glucose also induced translocation of TRPV2, which was blocked by nefedipine, diazoxide, and somatostatin, agents blocking glucose-induced insulin secretion. Knockdown of the insulin receptor attenuated insulin-induced translocation of TRPV2. Similarly, the effect of insulin on TRPV2 translocation was not observed in a beta-cell line derived from islets obtained from a beta-cell-specific insulin receptor knockout mouse. Knockdown of TRPV2 or addition of tranilast significantly inhibited insulin secretion induced by a high concentration of glucose. Likewise, cell growth induced by serum and glucose was inhibited by tranilast or by knockdown of TRPV2. Finally, insulin-induced translocation of TRPV2 was observed in cultured mouse beta-cells, and knockdown of TRPV2 reduced insulin secretion induced by glucose.

Conclusions: TRPV2 is regulated by insulin and is involved in the autocrine action of this hormone on beta-cells.


Figures

FIG. 1.
FIG. 1.
Expression and translocation of TRPV2 in MIN6 cells. A: Expression of the TRPV family members in MIN6 cells. Expression of mRNA for various members of the TRPV family in MIN6 cells was measured by RT-PCR. Note that primers used in this study are able to detect mRNA for various members of the TRPV family (10,11). B: Effect of serum on localization of TRPV2. MIN6 cells were transfected with TRPV2-GFP using adenovirus vector, and the GFP fluorescence was measured. Cells were preincubated with serum-free medium for 3 h and then incubated with 15% FBS for 15 min (b) and 60 min (c). Fluorescence images before (a) and after stimulation (b and c) are presented. C: Semiquantitative analysis of the effect of serum. MIN6 cells transfected with TRPV2-GFP were incubated for 15% FBS for 30 min in the presence and absence of 50 μmol/l LY294002. The number of cells in which TRPV2 was located in the plasma membrane was counted in each condition. Data are means ± SE for five experiments, and each numbered at least 100 cells.
FIG. 2.
FIG. 2.
Effect of insulin on translocation of TRPV2 in MIN6 cells. A: Effect of exogenous insulin on translocation. MIN6 cells transfected with TRPV2-GFP were preincubated with KRB buffer containing 2.7 mmol/l glucose for 1 h. They were then incubated with 10 nmol/l insulin for 30 min, and fluorescence images before (a) and after stimulation (b) are shown. B: Localization of TRPV2. a: Colocalization of TRPV2 with an ER marker. Fluorescence images were obtained in unstimulated MIN6 cells expressing TRPV2-RFP (red) and ER-YFP (green). Under a basal condition, most of the TRPV2 signals colocalized with the ER marker. b and c: Colocalization of TRPV2 with a plasma membrane marker. Fluorescence images were obtained in unstimulated (b) and insulin-stimulated (c) MIN6 cells expressing TRPV2-RFP (red) and PM-YFP (green). Under a basal condition, the TRPV2 signal was not colocalized with the PM marker, whereas some of the TRPV2 signals were colocalized with the PM marker in insulin-stimulated cells. C: Effect of insulin on translocation of c-myc–tagged TRPV2. MIN6 cells transfected with c-myc–tagged TRPV2 were preincubated with KRB buffer containing 2.7 mmol/l glucose for 1 h. They were then incubated for 30 min with (b) or without (a) 10 nmol/l insulin. The c-myc epitope was stained in intact cells. Bar: 20 μm. D: Quantification of the immunoreactivity of c-myc epitope. MIN6 cells transfected with c-myc–tagged TRPV2 were incubated for 30 min in various conditions, and cell surface expression of c-myc was quantified. Anti-Ins, anti-insulin antibody. *P < 0.05 vs. none; **P < 0.01 vs. none. E: Effect of BAPTA loading on basal secretion of insulin. MIN6 cells loaded with or without BAPTA were incubated for 60 min in the presence of 2.7 mmol/l glucose, and insulin secretion was measured. Values are the mean ± SE for four experiments. *P < 0.05 vs. control. F: Effect of serum on translocation of c-myc–tagged TRPV2 in CHO cells. CHO cells transfected with c-myc–tagged TRPV2 were incubated for 30 min with (b) or without (a) 10% serum. The c-myc epitope was stained in intact cells. Bar: 20 μm. (Please see http://dx.doi.org/10.2337/db08-0862 for a high-quality digital representation of this figure.)
FIG. 3.
FIG. 3.
Assessment of TRPV2 translocation by using c-myc–tagged TRPV2 in MIN6 cells. A: Dose-response relationship for the effect of insulin. MIN6 cells expressing c-myc–tagged TRPV2 were loaded with BAPTA and then incubated for 30 min with various doses of insulin, and cell surface expression of c-myc was quantified. Values are the means ± SE for three experiments. B: Time course of the effect of insulin. c-myc–TRPV2–expressing MIN6 cells loaded with BAPTA were incubated for various periods with 10 nmol/l insulin, and the cell surface expression of TRPV2 was measured. Values are the mean ± SE for four experiments. C: Effect of latrunculin A and nocodazole on translocation of TRPV2. MIN6 cells expressing c-myc–tagged TRPV2 were pretreated with 25 μmol/l latrunculin A (Ltr.) or 10 μmol/l nocodazole (Ncd.) for 30 min. Then the cells were stimulated with 10 nmol/l insulin for 30 min and the cell surface expression of TRPV2 was quantified. Values are the means ± SE for four experiments. *P < 0.05. D: Effect of glucose on translocation of TRPV2. MIN6 cells expressing c-myc–tagged TRPV2 were preincubated with KRB buffer containing 2.7 mmol/l glucose for 1 h. They were then incubated for 60 min with various agents, and cell surface expression of TRPV2 was quantified. Values are the means ± SE for four experiments. DZX, 100 μmol/l diazoxide; NF, 1 μmol/l nifedipine; SST, 10 nmol/l somatostatin. **P < 0.05 vs. none; *P < 0.05 vs. insulin. E: Effect of high concentration of potassium on translocation of TRPV2. MIN6 cells expressing c-myc–tagged TRPV2 were preincubated with KRB buffer containing 2.7 mmol/l glucose for 1 h. They were then incubated for 60 min with 40 mmol/l KCl in the presence and absence of 10 μmol/l nifedipine (NF), and cell surface expression of TRPV2 was quantified. Values are the means ± SE for four experiments. **P < 0.01 vs. none, *P < 0.05 vs. KCl. F: Translocation of endogenous TRPV2 in MIN6 cells. MIN6 cells were incubated for 20 min with (b) or without (a) 10 nmol/l insulin, and the cell surface expression of TRPV2 was measured by staining intact cells with anti-TRPV2 antibody recognizing extracellular domain. G: Quantification of translocation of endogenous TRPV2. MIN6 cells were incubated for 20 min with 10 nmol/l insulin, 25 mmol/l glucose, or 40 mmol/l KCl, and the cell surface expression of TRPV2 was quantified. Values are the mean ± SE for five experiments. *P < 0.01 vs. none.
FIG. 4.
FIG. 4.
Assessment of the role of the insulin receptor in insulin-induced translocation of TRPV2. A: Effect of shRNA on the expression of the insulin receptor. MIN6 cells were transfected with Ad-shLacZ or Ad-shIR, and the expression of IR was quantified by real-time RT-PCR. Values are the mean ± SE for four experiments. B: Effect of insulin in shRNA-treated cells. MIN6 cells transfected with Ad-shIR were incubated for 30 min in the absence (a) or presence (b) of 10 nmol/l insulin or 15% FBS (c), and cell surface expression of c-myc–TRPV2 was measured. C: Quantification of the results of B. *P < 0.01 vs. none. D: Effect of insulin and FBS on cell-surface expression of c-myc–TRPV2 in βIRKO cells. βIRKO cells (a–c) and control βWT cells (df) expressing c-myc–TRPV2 were incubated for 30 min in the absence (a and d) and presence (b and e) of 10 nmol/l insulin or 15% FBS (c and f), and cell surface expression of c-myc–TRPV2 was measured. E: Quantification of the results of D. a: βIRKO cells. b: Control βWT cells. *P < 0.05 vs. none.
FIG. 5.
FIG. 5.
Effect of insulin on calcium entry in MIN6 cells. A and B: Measurement of changes in [Ca2+]c. Fura-2–loaded MIN6 cells were incubated for 30 min in calcium-free KRB in the presence (B) and absence (A) of 10 nmol/l insulin. Extracellular medium was then switched to 2 mmol/l calcium-containing KRB with (○) or without (•) 75 μmol/l tranilast as indicated, and changes in the [Ca2+]c were monitored. The results are representative of at least 10 experiments. C: Measurement of calcium entry by monitoring Mn2+ quenching. Fura-2–loaded MIN6 cells were incubated for 20 min in the presence (•) or absence (○) of 10 nmol/l insulin. MnCl2 (0.1 mmol/l) was then added, and changes in the fluorescence were monitored. Values are the mean ± SE for five determinations and representative of five experiments with similar results. D: Effect of tranilast on Mn2+ quenching. Experiments were done as shown in C except that 75 μmol/l tranilast was added together with MnCl2.
FIG. 6.
FIG. 6.
Effect of tranilast on insulin secretion and proliferation in MIN6 cells. A: Effect of tranilast on insulin secretion. MIN6 cells were preincubated with KRB buffer containing 2.7 mmol/l glucose for 30 min. They were then stimulated with 25 mmol/l glucose or 40 mmol/l KCl for 60 min in the presence and absence of 75 μmol/l tranilast. Values are the mean ± SE for four determinations, and the results are representative of three experiments. *P < 0.05. B: Effect of tranilast on insulin secretion in permeabilized cells. Permeabilized MIN6 cells were incubated for 60 min with 10 μmol/l calcium in the presence and absence of 75 μmol/l tranilast. Insulin secretion in medium containing EGTA was subtracted. Values are the mean ± SE for four experiments. C: Effect of tranilast on [3H]thymidine incorporation. MIN6 cells were incubated for 48 h with or without 15% FBS and 25 mmol/l glucose in the presence and absence of 75 μmol/l tranilast, and [3H]thymidine in corporation was then measured. Values are the mean ± SE for four experiments. *P < 0.05. D: Effect of tranilast on the cell number. MIN6 cells were incubated for various periods with 15% FBS and 25 mmol/l glucose in the presence (•) and absence (○) of 75 μmol/l tranilast. Values are the mean ± SE for three experiments, and the cell number was counted. *P < 0.05 vs. none.
FIG. 7.
FIG. 7.
Effect of shRNA for TRPV2 on insulin secretion and proliferation in MIN6 cells. A: Effect of Ad-shTRPV2 on the expression of mRNA for TRPV2. MIN6 cells were transfected with Ad-shLacZ or Ad-shTRPV2, and the expression of mRNA for TRPV2 was measured by real-time RT-PCR. Values are the mean ± SE for four experiments. *P < 0.05 vs. Ad-shLacZ. B: Effect of Ad-shTRPV2 on the protein expression of TRPV2. MIN6 cells were transfected with Ad-shLacZ (shLZ) or Ad-shTRPV2 (shV2). Expression of TRPV2 was measured by immunoblotting. C: Effect of knockdown of TRPV2 on calcium entry. MIN6 cells were transfected with Ad-shLacZ (a) or Ad-shTRPV2 (b). Calcium entry was assessed by measuring Mn2+ quenching in the presence (•) and absence (○) of 10 nmol/l insulin. D: Effect of knockdown of TRPV2 on glucose-induced changes in [Ca2+]c. MIN6 cells infected with Ad-shTRPV2 (○) or Ad-shLacZ (•) were stimulated with 25 mmol/l glucose, and [Ca2+]c was monitored. E: Effect of knockdown of TRPV2 on glucose-induced elevation of [Ca2+]c. Experiments were performed as shown in Fig. 7D, and area under the curve (AUC) was calculated. Values are the mean ± SE for five experiments. *P < 0.05 vs. shLacZ. F: Effect of shRNA for TRPV2 on insulin secretion. MIN6 cells were infected with Ad-shLacZ or Ad-shTRPV2. Infected cells were preincubated with KRB buffer containing 2.7 mmol/l glucose for 30 min. They were then incubated for 60 min with 25 mmol/l glucose or 40 mmol/l KCl, and secreted insulin was measured. Values are the mean ± SE for four determinations and are representative of three experiments. *P < 0.05. G: Effect of shRNA for TRPV2 on [3H]thymidine incorporation. MIN6 cells were infected with Ad-shLacZ or Ad-shTRPV2. Infected cells were further incubated for 48 h with 15% FBS and 25 mmol/l glucose, and [3H]thymidine incorporation between 44 and 48 h was measured. Values are the mean ± SE for four experiments. *P < 0.05. H: Effect of shRNA for TRPV2 on the cell number. MIN6 cells were infected with Ad-shLacZ (○) or Ad-shTRPV2 (•) and incubated for indicated period with 15% FBS and 25 mmol/l glucose. The number of cells was counted. Values are the mean ± SE for four experiments. *P < 0.05 vs. Ad-shLacZ–treated cells.
FIG. 8.
FIG. 8.
Effect of insulin on TRPV2 translocation in mouse β-cells. A: Expression of TRPV2 in mouse islet. Mouse pancreatic section was stained with anti-TRPV2 (red) and anti-glucose (green) antibodies. Nuclei were stained with DAPI (blue). B: Effect of insulin on the cell surface expression of c-myc epitope in cultured β-cells. c-myc–TRPV2–expressing cultured β-cells were incubated with (b) or without (a) 10 nmol/l insulin for 30 min, and intact cells were stained with anti–c-myc antibody. C: Quantification of the effect of insulin and glucose on TRPV2 translocation. c-myc–TRPV2–expressing β-cells were incubated for 60 min with various agents, and cell surface c-myc TRPV2 was quantified. Values are the mean ± SE for four experiments. *P < 0.05 vs. none. **P < 0.05 vs. glucose. D: Effect of Ad-shTRPV2 on insulin secretion from cultured β-cells. Cultured β-cells were infected with Ad-shLacZ or Ad-shTRPV2. Cells were preincubated for 30 min with KRB buffer containing 2.7 mmol/l glucose. They were then incubated for 1 h with 16.7 mmol/l glucose or 40 mmol/l KCl, and insulin secretion was quantified. Data are means ± SE for four experiments. *P < 0.05. (Please see http://dx.doi.org/10.2337/db08-0862 for a high-quality digital representation of this figure.)

Similar articles

Cited by

References

    1. Kulkarni RN, Bruning JC, Winnay JN, Postic C, Magnuson MA, Kahn CR: Tissue-specific knockout of the insulin receptor in pancreatic β cells creates an insulin secretory defect similar to that in type 2 diabetes. Cell 96: 329–339, 1999 - PubMed
    1. Otani K, Kulkarni RN, Baldwin AC, Krutzfeldt J, Ueki K, Stoffel M, Kahn CR, Polonski KS: Reduced β-cell mass and altered glucose sensing impair insulin-secretory function in βIRKO mice. Am J Physiol 286: E41–E49, 2004 - PubMed
    1. Strivastava S, Goren HJ: Insulin constitutively secreted by β-cells is necessary for glucose-stimulated insulin secretion. Diabetes 52: 2049–2056, 2003 - PubMed
    1. Silva Xavier G, Qian Q, Cullen PJ, Rutter GA: Distinct roles for insulin and insulin-like growth factor receptors in pancreatic β-cell glucose sensing revealed by RNA silencing. Biochem J 377: 149–158, 2004 - PMC - PubMed
    1. Montell CK, Jones K, Hafen E, Rubin G: Rescue of the Drosophlia phototransduction mutation trp by germline transformation. Science 230: 1040–1043, 1985 - PubMed

Publication types

MeSH terms