. 2008 Nov 4;14(5):382-93.
doi: 10.1016/j.ccr.2008.10.005.

miR-296 regulates growth factor receptor overexpression in angiogenic endothelial cells

Affiliations

miR-296 regulates growth factor receptor overexpression in angiogenic endothelial cells

Thomas Würdinger et al. Cancer Cell. .

Abstract

A key step in angiogenesis is the upregulation of growth factor receptors on endothelial cells. Here, we demonstrate that a small regulatory microRNA, miR-296, has a major role in this process. Glioma cells and angiogenic growth factors elevate the level of miR-296 in primary human brain microvascular endothelial cells in culture. The miR-296 level is also elevated in primary tumor endothelial cells isolated from human brain tumors compared to normal brain endothelial cells. Growth factor-induced miR-296 contributes significantly to angiogenesis by directly targeting the hepatocyte growth factor-regulated tyrosine kinase substrate (HGS) mRNA, leading to decreased levels of HGS and thereby reducing HGS-mediated degradation of the growth factor receptors VEGFR2 and PDGFRbeta. Furthermore, inhibition of miR-296 with antagomirs reduces angiogenesis in tumor xenografts in vivo.


Figures

Fig. 1
Fig. 1
Glioma-induced disregulation of miRNAs in human brain endothelial cells (A) Primary human brain microvascular endothelial cells (HBMVEC) were cultured in the absence (left) or presence (right) of human U87-CFP glioma cells. Images were produced by using a combination of light and fluorescence microscopy, size bar 100 μm. (B) Array hybridization analysis of miRNAs extracted from CD-31+ cells, sorted from HBMVECs cultured without (upper array) or with (lower array) U87-CFP glioma cells for 24 hr. The density of the hybridization signals (black spots) reflects the relative expression level of particular miRNAs. Red circles indicate miRNAs which are significantly altered by co-culture with glioma cells. (C) A list of significantly decreased (fold change <0.5) or increased (fold change >1.9) miRNAs in HBMVECs exposed to U87-CFP glioma cells. (D) Overexpression of miR-296 was confirmed by qRT-PCR analysis. RNA extracted from CD31+ HBMVECs cultured in the absence or presence of U87 glioma cells was analyzed by qRT-PCR. The data were normalized to the level of GAPDH mRNA in each sample. (E) HBMVECs were cultured in the presence or absence of U87 glioma cells, isolated using CD31 beads, and subjected to miR-296 qRT-PCR. Alternatively, HBMVECs were cultured in various culture media and subjected to miR-296 qRT-PCR, the miR-296 levels were normalized to EBM (CD31). Error bars indicate S.D., *p < 0.05, ***p < 0.001, t test.
Fig. 2
Fig. 2
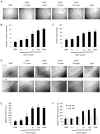
VEGF-mediated induction of tubule formation, migration, and miR-296 expression (A) HBMVECs cells were cultured on Matrigel-coated plates in basal medium (EBM; Cambrex) only, basal medium supplemented with a cocktail of angiogenic factors (EGM), or different amounts of VEGF [size bar 300 μm], and analyzed for tubule branching (B) and tubule length (C) after 24 hr. (D) HBMVEC monolayer cultures were scratched and incubated as in (A). Directly after scratching (t = 0) and 24 hr later (t = 24) images were taken, size bar 300 μm. The dashed lines indicate the front of migration. (E) Quantitation of migration distance using MetaVue software. (F) HBMVECs were cultured as in (A) for 24 hr, after which RNA was isolated to determine the levels of miR-296 and miR-186 expression by qRT-PCR, The data were normalized to the level of GAPDH mRNA in each sample. Error bars indicate S.D.
Fig. 3
Fig. 3
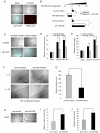
Angiogenesis co-culture assay: miR-296-mediated inhibition and induction of angiogenesis (A) HBMVECs cells were cultured on Matrigel-coated plates in basal medium (EBM; Cambrex) only, or basal medium supplemented with a cocktail of angiogenic factors (EGM), or with U87-CFP cells [size bar 300 μm]. Transfection efficiency of endothelial cells was determined (>99%) by using siRNA-Cy3 molecules [monolayer culture, size bar 50 μm]. (B) HBMVECs were transfected with anti-miR-296 inhibitor, pre-miR-296, or non-related control molecules and cultured in the presence or absence of U87-CFP cells. Inhibition and overexpression of miR-296 in CD31+-isolated endothelial cells was quantified by qRT-PCR. (C) HBMVECs were transfected with anti-miR-296 inhibitor or non-related control molecules and analyzed for tubule formation, size bar 300 μm. (D and E) Tubule formation was evaluated at 48 hr after transfection including 24 hr of culturing on Matrigel using the imaging program Image J. A significant decrease in tubule branching (D) and tubule length (E) was observed after transfection with the miR-296 inhibitor. (F) HBMVECs were transfected with anti-miR-296 inhibitor or non-related control molecules and analyzed for migration capacity. Inhibition of miR-296 resulted in a significant decrease in migration, as quantified in (G). (H) Overexpression of miR-296 at 24 hr after transfection of pre-miR-296 molecules resulted in increased angiogenesis in vitro [size bar 300 μm], as quantified by measuring tubule branching (I) and tubule length (J). Error bars indicate S.D., **p < 0.01 and ***p < 0.001, t test.
Fig. 4
Fig. 4
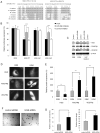
HGS is a direct target of miR-296 (A) Alignment of potential miR-296-binding sites in the 3' UTR of the HGS mRNA of different species. (B) pMir-Report vectors containing no 3'UTR (MCS), or containing the 3' UTR of the HGS mRNA (HGS WT) or mutated miR-296 binding sites (HGS mut1 and HGS mut2) and miR-296 or control inhibitors were co-transfected into HEK 293T cells. The inhibition of miR-296 by the anti-sense inhibitors resulted in a significant increase in luciferase signals of HGS WT and HGS mut2 but not HGS mut1 transfected cells. (C) Western blot analysis of HGS, PDGFR-β and VEGFR2 expression in HBMVECs cultured in basal medium (EBM) or HBMVECs stimulated by EGM or U87-conditioned medium. HGS expression decreased upon stimulation of HBMVECs, and PDGFR-β and VEGFR2 increased. Upon inhibition of miR-296 with anti-miR-296 molecules by transfection of HBMVECs stimulated by EGM or U87-conditioned medium, HGS expression increased, and PDGFR-β and VEGFR2 decreased. The relative blot intensities were quantified by using ImageQuant, the densitometric values normalized to β-Actin are indicated. (D)HGS, PDGFR-β and VEGFR2 expression levels under normal and angiogenic conditions. Representative images of HBMVEC immunostainings of HGS, PDGFR-β and VEGFR2 under normal (EBM) and angiogenic (EGM) conditions, size bar 20 μm. (E) Quantification of the HGS, PDGFR-β and VEGFR2 immunostaining levels, as represented in (D). Fluorescence signals were quantified using MetaVue software by analyzing at least 20 random cells per sample. (F) Silencing of HGS by siRNAs leads to increased HBMVEC tubule formation on Matrigel [size bar 300 μm], as quantified in (G) and (H). Error bars indicate S.D., **p < 0.01, ***p < 0.001, t test.
Fig. 5
Fig. 5
miR-296 affects HGS-modulated PDGFR-β and VEGFR2 expression (A) HGS immunostaining of HBMVECs after treatment with miR-296 inhibitors, anti-HGS siRNAs, and pre-miR-296 molecules, size bar 20 μm. (B) Immunostaining of PDGFR-β and VEGFR2 48 hr after transfection shows that transfection of pre-miR-296 molecules, as well as anti-HGS siRNAs, resulted in increased PDGFR-β and VEGFR2 expression in HBMVECs, size bar 20 μm. (C) Western blot analysis of HGS, PDGFR-β and VEGFR2 expressio in HBMVECs upon silencing of HGS by HGS siRNA or pre-miR-296. The relative blot intensities were quantitated by using ImageQuant, the densitometric values are indicated. (D) Quantification of the HGS immunostaining levels, as represented in (A). (E) Increased cellular levels of immunoreactive PDGFR-β and VEGFR2 seen in (B) were quantified using MetaVue software by analyzing at least 20 random cells per sample. Error bars indicate S.D., **p < 0.01, ***p < 0.001, t test.
Fig. 6
Fig. 6
Blocking of VEGFR2 reduces angiogenesis in vitro (A) HBMVECs were stimulated using U87-conditioned medium and cultured on Matrigel-coated plates in the presence or absence of VEGFR2 blocking antibody, size bar 300 μm. (B) After 24 hr VEGFR2 blocking significantly reduced tubule branching and tubule length. (C) HBMVECs cultured in a monolayer, scratched, and incubated in the presence or absence of VEGFR2 blocking antibody for 24 hr. VEGFR2 blocking resulted in a significant decrease in HBMVEC migration [size bar 300 μm], as quantified in (D). Error bars indicate S.D., ***p < 0.001, t test.
Fig. 7
Fig. 7
In vivo analysis of miR-296 inhibition on tumor neo-vascularization (A) Mice with subcutaneous U87 tumors (N = 6) were injected intravenously with miR-296 antagomirs or mismatch control antagomirs and 4 days later, the same mice were injected with Angiosense 750 and tumor vasculature was analyzed with FMT. Planar (top) and 3-D FMT images (bottom) are displaced in which the fluorescence signals are superimposed with the grayscale planar excitation light image of the mouse. (B) Quantitation of the mean fluorescence intensity measurements from tumors in (A) using OsiriX. Error bars indicate S.D., *p < 0.05, t test. (C) Transverse T1-weighted MR images (4.7T) acquired to show the tumor volume in (A), the white arrows indicate tumor mass
Fig. 8
Fig. 8
Analysis of expression of miR-296 and its targets in tumor endothelial cells isolated from human gliomas (A) RNA was isolated from primary endothelial cell cultures (passage 0) prepared from normal human brain (NNB; N = 3), grade II astrocytomas (N = 3) and grade IV glioblastoma multiforme (N = 3). (B) RNA extracted from individual tumor endothelial samples was analyzed by qRT-PCR for expression levels of miR-296 and miR-186. All values were normalized to GAPDH mRNA levels in the same samples. (C) Immunohistochemical staining of brain blood vessels indicate increased and morphologically abnormal tumor blood vessels, as well as differential HGS, PDGFR-β, and VEGFR2 expression in non-neoplastic brain (NNB) and malignant glioma (GBM). Size bar 100 μm. (D) RNA extracted from individual tumor endothelial samples was analyzed by qRTPCR for expression levels of VEGF. All values were normalized to GAPDH mRNA levels in the same samples. (E) Schematic overview of the proposed angiogenic mechanism of miR-296. miR-296 is up-regulated in glioma endothelial cells and directly inhibits expression of HGS, thereby allowing the accumulation of growth factor receptors by attenuating their degradation. GF, growth factor; GFR, growth factor receptor. Error bars indicate S.D., ***p < 0.001, t test.

Similar articles

Cited by

References

    1. Ambros V. The functions of animal microRNAs. Nature. 2004;431:350–355. - PubMed
    1. Bache KG, Raiborg C, Mehlum A, Stenmark H. STAM and Hrs are subunits of a multivalent ubiquitin-binding complex on early endosomes. J Biol Chem. 2003;278:12513–12521. - PubMed
    1. Bartel DP. MicroRNAs: genomics, biogenesis, mechanism, and function. Cell. 2004;116:281–297. - PubMed
    1. Batchelor TT, Sorensen AG, di Tomaso E, Zhang WT, Duda DG, Cohen KS, Kozak KR, Cahill DP, Chen PJ, Zhu M, et al. AZD2171, a pan-VEGF receptor tyrosine kinase inhibitor, normalizes tumor vasculature and alleviates edema in glioblastoma patients. Cancer Cell. 2007;11:83–95. - PMC - PubMed
    1. Brem S, Cotran R, Folkman J. Tumor angiogenesis: a quantitative method for histologic grading. J Natl Cancer Inst. 1972;48:347–356. - PubMed

Publication types

MeSH terms

Substances

Associated data