Review
. 2008 Dec;9(12):981-91.
doi: 10.1038/nrm2530. Epub 2008 Oct 30.

Design principles of biochemical oscillators

Affiliations
Review

Design principles of biochemical oscillators

Béla Novák et al. Nat Rev Mol Cell Biol. 2008 Dec.

Abstract

Cellular rhythms are generated by complex interactions among genes, proteins and metabolites. They are used to control every aspect of cell physiology, from signalling, motility and development to growth, division and death. We consider specific examples of oscillatory processes and discuss four general requirements for biochemical oscillations: negative feedback, time delay, sufficient 'nonlinearity' of the reaction kinetics and proper balancing of the timescales of opposing chemical reactions. Positive feedback is one mechanism to delay the negative-feedback signal. Biological oscillators can be classified according to the topology of the positive- and negative-feedback loops in the underlying regulatory mechanism.


Figures
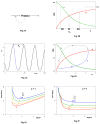
Figure 1
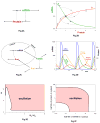
Figure 1. Time-delayed negative feedback oscillator
a| Protein level is determined by opposing processes of synthesis and degradation. Protein synthesis is down-regulated by the protein itself. b| Curves a and b are the rates of protein synthesis and degradation, respectively. The arrows indicate the direction of change of protein concentration, which is always towards Yo, the steady state concentration of protein, where the rate of synthesis equals the rate of degradation. c| Sustained oscillations for Eq. (2), with p = 2, Km/Kd=1, S/Kd =1, k1 = k2ET/Kd = 1 min-1, and τ = 10 min. The period of oscillation is Tc = 27.2 min. d| In curve c we plot the time-delayed rate of protein synthesis, 1/(1+Y(tτ)p), as a function of the present protein concentration, Y(t). The dashed portion of curve c corresponds to the dashed portion of the oscillation in panel c; it is τ time units in duration, and it extends from the maximum value of Y (at t = 20 min) to the minimum value of the rate of production of Y (at t = 30 min). The time-delayed loop repeatedly overshoots and undershoots the steady state because the protein synthesis rate is no longer given by curve a at Y(t) but by curve a at Y(t - τ). e| Constraint curves for p = 1. Each curve is drawn for a specific value of Kd/Km. For each case, Eq. (2) exhibits sustained oscillations in the region above the curve. f| Constraint curves for p = 2. Notice that the oscillatory domain becomes larger as p increases and as Kd/Km increases, i.e., as the kinetic rate laws become more nonlinear.
Figure 2
Figure 2. Multi-component, negative feedback oscillator
a| Negative feedback between mRNA and protein, as described by kinetic equations (3). b| Representative solutions (dashed curves) of the kinetic equations (3), for parameter values: p = 2, Km/Kd =1, S/Kd =1, k1 = kdx = 0.1 min-1, ksy = k2ET/Kd = 1 min-1. Notice that every trajectory spirals into the stable steady state located at the black circle. Curves a and b are ‘nullclines’ for differential equations (3), as explained in the text. The small arrows indicate the direction of motion of trajectories as they cross the nullclines. Notice that the nullclines in this figure are identical to the rate curves in Fig. 1b. c| The negative feedback loop taking into account transport of macromolecules between nucleus and cytoplasm. d| Sustained oscillations for the four-component loop in panel c. See supplementary information S1 (box) for details. e| Nonlinearity constraint. For the negative feedback loop to oscillate, p and Kd /Km must be large enough. f| Time-scale balancing constraint. The half-lives of mRNA in the nucleus and of protein in the cytoplasm must lie in the shaded band in order for the negative feedback loop to oscillate.
Figure 3
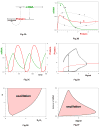
Figure 3. Hysteresis-driven, negative feedback oscillator
a| mRNA and protein in a negative feedback loop, as in Figure 2, and the protein inhibits its own degradation. This mechanism is described by kinetic equations (4). b| Limit cycle solution (curve c) of Eqs. (4) for parameter values: p = 4, Km/Kd =0.1, Kd·KI = 2, S =1, k1 = kdx = kdy = 0.05 min-1, ksy = k2ET/Kd = 1 min-1. Curves a and b as in Fig. 2b, except that curve b is given by X = kdyY+Y/(Km+Y+KIY2). c| Sustained oscillations of mRNA and protein, corresponding to curve c in panel b. d| Signal-response curve. Solid lines: stable steady states; dashed lines: unstable steady states; black circles: maximum and minimum excursions of Y(t) during a limit cycle oscillation. The oscillation in panel c is indicated by the double-headed arrow at S = 1. Notice that oscillations are possible only for a restricted range of signal strengths, S. e| Nonlinearity constraint. For this mechanism to oscillate, the positive feedback loop must be strong enough (KI sufficiently large) and the negative feedback loop must be sufficiently nonlinear (p must be large enough). f| Time-scale balancing constraint. The turnover rate of mRNA (kdx) cannot be too large, and the signal strength (S) must be within specific bounds for this system to oscillate.
Figure 4
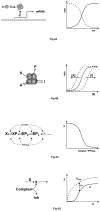
Figure 4. Sources of nonlinearity
a| Oligomer binding. Left: a transcription factor (blue ball) forms an n-component homo-oligomer, which then binds upstream of a structural gene and either activates or represses mRNA synthesis. Right: rate of mRNA synthesis as a function of transcription factor concentration, for an activator (solid line) or a repressor (dashed line). b| Cooperativity and allostery. Left: an enzyme, consisting of two catalytic subunits (spheres) and two regulatory subunits (cubes), catalyzes the conversion of substrate into product. Activators and inhibitors bind to specific sites on the regulatory subunits. Right: if the binding of substrate to the catalytic subunits is cooperative, then the rate of reaction as a function of substrate concentration is sigmoidal (solid line). The rate curve can be shifted to the left or to the right by increasing concentrations of activator or inhibitor, respectively. c| Multisite phosphorylation. Left: a regulatory protein, X, is phosphorylated on multiple sites by a protein kinase and dephosphorylated by a protein phosphatase. Right: Concentration of the unphosphorylated form of X as a function of the ratio of activities of kinase and phosphatase. d| Stoichiometric inhibition. Left: a regulatory protein, X, is synthesized in response to a signal, S. X binds strongly to an inhibitor to form an inactive complex. Right: the concentration of total X increases hyperbolically with S (dashed line) but the concentration of ‘free’ X is a sigmoidal function of S (solid line).
Figure 5
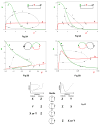
Figure 5. A classification scheme for biochemical oscillators
We classify oscillators by their interaction motifs, where X → Y means ‘X activates Y’, Y ⊣X means ‘Y inhibits X’, and W ⊸ X means ‘W may either activate or inhibit X’. If two white circles appear in the same regulatory motif, they must have the same sign (either ++ or −−). We assume that all interactions are positive or negative (not mixed-mode) and all self-interactions are negative. a| Class 1: delayed negative feedback loops. Below each feedback loop, we present a state-space diagram in the style of Fig. 1d. We plot ‘activator’ X vs ‘inhibitor’ Y (left) or Z (right). Curve c is a projection of the limit cycle oscillation onto the XY plane. b| Class 2: amplified negative feedback loops. Either the activator X may be amplified by positive feedback with W (left), or the inhibitor Y may be amplified by positive feedback with Z (right). For each motif, we plot the limit cycle oscillation (curve c) on the XY plane. c| Class 3: incoherently amplified negative feedback loops. Each motif consists of a three-component negative feedback loop (‘oscillatory’) and a two-component positive feedback loop (‘amplifying’). Each motif also contains an incoherent feed-forward loop that may originate from either X or Y. To the left and right of each motif we indicate how the state-space diagram will appear, depending upon which variable is plotted on the abscissa and which on the ordinate.
Figure 6
Figure 6. Chaotic oscillators
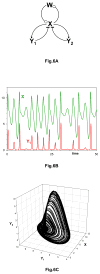
a| Activator-amplification with two negative feedback loops in parallel. b| Chaotic trajectory for the mechanism in panel a. See supplementary information S1 (box) for details. c| Projection of the chaotic trajectory into the three-dimensional state space (X, Y1, Y2). The chaotic trajectory was recomputed from the equations and parameter values in Rössler.

Similar articles

Cited by

References

    1. Pye K, Chance B. Sustained sinusoidal oscillations of reduced pyridine nucleotide in a cell-free extract of Saccharomyces carlsbergensis. Proc Natl Acad Sci U S A. 1966;55:888–894. - PMC - PubMed
    1. Hess B, Boiteux A. Oscillatory phenomena in biochemistry. Annu Rev Biochem. 1971;40:237–258. - PubMed
    1. Gerisch G, Fromm H, Huesgen A, Wick U. Control of cell-contact sites by cyclic AMP pulses in differentiating Dictyostelium cells. Nature. 1975;255:547–549. - PubMed
    1. Olsen LF, Degn H. Oscillatory kinetics of the peroxidase-oxidase reaction in an open system. Experimental and theoretical studies. Biochim Biophys Acta. 1978;523:321–334. - PubMed
    1. Olsen LF, Degn H. Chaos in an enzyme reaction. Nature. 1977;267:177–178. - PubMed

Publication types