. 2009 Jan 9;284(2):1145-54.
doi: 10.1074/jbc.M806964200. Epub 2008 Oct 27.

MacB ABC transporter is a dimer whose ATPase activity and macrolide-binding capacity are regulated by the membrane fusion protein MacA

Affiliations

MacB ABC transporter is a dimer whose ATPase activity and macrolide-binding capacity are regulated by the membrane fusion protein MacA

Hong Ting Lin et al. J Biol Chem. .

Abstract

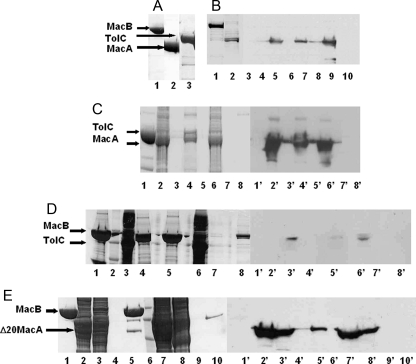
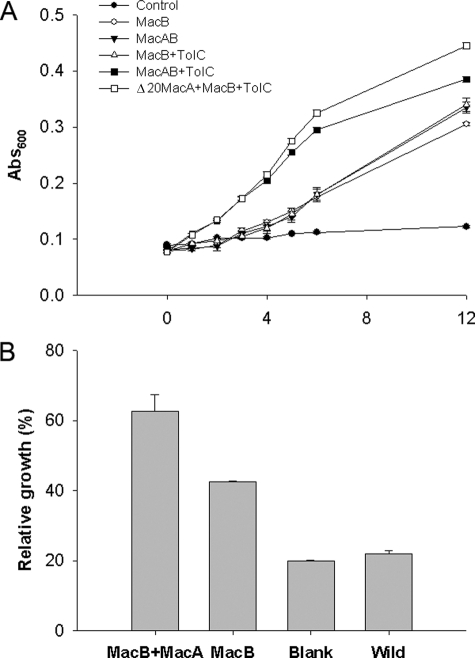
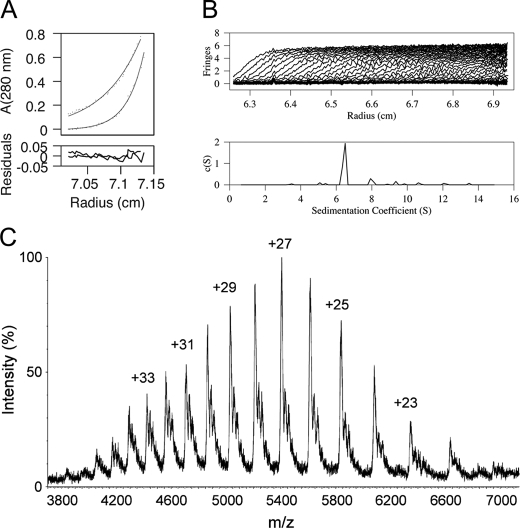
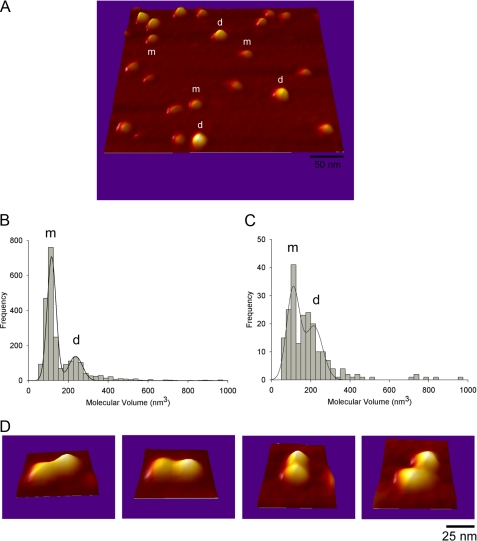
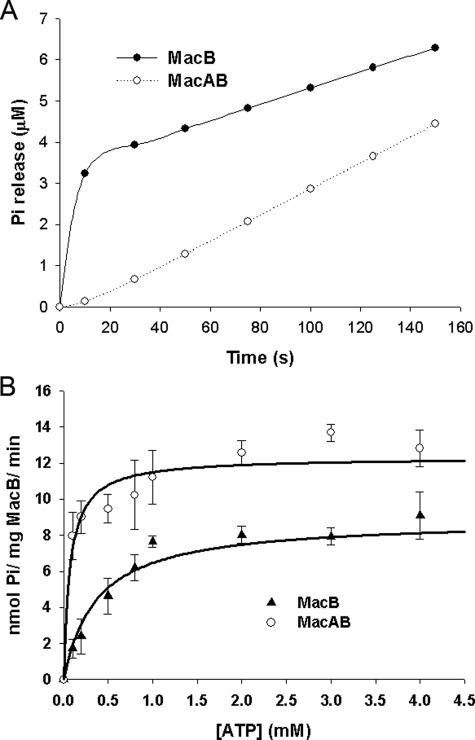
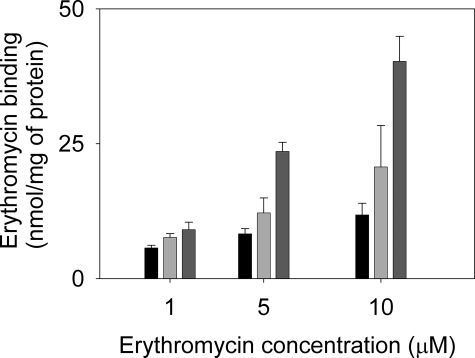
Gram-negative bacteria utilize specialized machinery to translocate drugs and protein toxins across the inner and outer membranes, consisting of a tripartite complex composed of an inner membrane secondary or primary active transporter (IMP), a periplasmic membrane fusion protein, and an outer membrane channel. We have investigated the assembly and function of the MacAB/TolC system that confers resistance to macrolides in Escherichia coli. The membrane fusion protein MacA not only stabilizes the tripartite assembly by interacting with both the inner membrane protein MacB and the outer membrane protein TolC, but also has a role in regulating the function of MacB, apparently increasing its affinity for both erythromycin and ATP. Analysis of the kinetic behavior of ATP hydrolysis indicated that MacA promotes and stabilizes the ATP-binding form of the MacB transporter. For the first time, we have established unambiguously the dimeric nature of a noncanonic ABC transporter, MacB that has an N-terminal nucleotide binding domain, by means of nondissociating mass spectrometry, analytical ultracentrifugation, and atomic force microscopy. Structural studies of ABC transporters indicate that ATP is bound between a pair of nucleotide binding domains to stabilize a conformation in which the substrate-binding site is outward-facing. Consequently, our data suggest that in the presence of ATP the same conformation of MacB is promoted and stabilized by MacA. Thus, MacA would facilitate the delivery of drugs by MacB to TolC by enhancing the binding of drugs to it and inducing a conformation of MacB that is primed and competent for binding TolC. Our structural studies are an important first step in understanding how the tripartite complex is assembled.


Figures

FIGURE 1.
FIGURE 1.
MacA interacts with both MacB and TolC. A, overexpression and purification of MacA, MacB, and TolC. An SDS-polyacrylamide gel of purified MacB (lane 1), MacA (lane 2), and TolC (lane 3) is shown. The purified His-tagged MacB and TolC proteins were used as bait, immobilized on a Ni2+-agarose column, over which a slurry of either detergent-solubilized membranes (e.g. from strains overexpressing S-tagged MacA or TolC) or soluble proteins (e.g. from strains overexpressing S-tagged Δ20MacA) was passed to test whether the cognate proteins from the tripartite pump could be pulled out of this complex mixture of proteins. B, pulldown of MacA by MacB. 1st and 2nd lanes, SDS-polyacrylamide gel of immobilized His-tagged MacB (1st lane) and the detergent-solubilized membranes from cells overexpressing the S-tagged MacA (2nd lane). 3rd to 11th lanes, Western blot using antibodies to the S-tag (1:5000 dilution) on MacA. The pulldown assay was performed with His-tagged MacB immobilized on a Ni2+-agarose column, over which a slurry of detergent-solubilized membranes from cells overexpressing S-tagged MacA was passed (7th to 9th lanes). The flow-through (9th lane), 100 mm imidazole wash (8th lane), and the 500 mm imidazole elution (7th lane) were tested for the presence of MacA, which was now also detected in the elution fraction, indicating that it was bound to MacB. A negative control experiment was performed in the absence of immobilized MacB in which MacA was passed through a Ni2+-agarose column (3rd to 5th lanes), and the flow-through (5th lane), 100 mm imidazole wash (4th lane), and the 500 mm imidazole elution (3rd lane) were tested for the presence of MacA, which was only found in the flow-through (5th lane), establishing that S-tagged MacA does not bind to the column. These results indicate that MacB can pull MacA from a complex mixture of membrane proteins. Purified His-tagged MacB did not cross-react with the antibodies to the S-tag (10th lane). C, pulldown of MacA by TolC. An SDS-polyacrylamide gel (lanes 1-8) for the pulldown of S-tagged MacA by His-tagged TolC and the corresponding Western blot (lanes 1-8′) probed with antibodies (1:5000 dilution) to the S-tag on MacA. Purified His-tagged TolC was immobilized on a Ni2+-agarose column (lanes 1 and 1′); a slurry of detergent-solubilized membranes from cells overexpressing S-tagged MacA was passed through the column and the proteins in the flow-through (lane 2 and 2′), released by washing the column with 100 mm imidazole (lanes 3 and 3′) and eluted with 500 mm imidazole (lanes 4 and 4′), were detected. As a negative control, S-tagged MacA was passed through the column (lanes 6 and 6′), in the absence of immobilized TolC, and the column was washed with 100 mm (lanes 7 and 7′) and 500 mm (lanes 8 and 8′). Comparing lane 4′ and 8′ demonstrates that MacA is only bound to the column in the presence of TolC, indicative of its interaction with TolC. D, pulldown of TolC by MacB. An SDS-polyacrylamide gel (lanes 1-4) for the pulldown of S-tagged TolC by His-tagged MacB and the corresponding Western blot (lanes 1-4′) probed with antibodies (1:5000 dilution) to the S-tag on TolC. Purified His-tagged MacB was immobilized on a Ni2+-agarose column (lanes 1 and 1′), and a slurry of detergent-solubilized membranes from cells overexpressing S-tagged TolC was passed through the column (lane 3 and 3′), which was then washed with 75 mm imidazole (lanes 4 and 4′), and bound proteins were eluted with 500 mm imidazole (lanes 5 and 5′). A weak band, which was not present in the absence of immobilized MacB, was apparent in lane 5′, indicative of a weak interaction between MacB and TolC. A control experiment was performed in the absence of immobilized MacB in which TolC was passed through a Ni2+-agarose column and the flow-through (lane 6), the 100 mm imidazole wash (lane 7), and the 500 mm imidazole elution (lane 8) were tested for the presence of TolC, which was only found in the flow-through (lane 6′), establishing that S-tagged TolC does not bind to the column. A protein Mr marker was run in lane 2. E, pulldown of N-terminal truncated MacA by MacB. An SDS-polyacrylamide gel shows the His-tagged MacB (lane 1) that was immobilized on a Ni2+-agarose column (lane 1), a slurry of cytoplasmic proteins released by disruption of cells overexpressing S-tagged Δ20-MacA (lane 2), which was passed through the column, over immobilized MacB, and the proteins in the flow-through detected (lane 3); the proteins were released by washing the column with 100 mm imidazole (lane 4); and the proteins were eluted with 500 mm imidazole (lane 5). A Western blot was performed on each of the corresponding protein fractions (indicated with 1-5′) using antibodies to the S-tag (1:5000 dilution) to detect S-tagged MacA. The elution of MacB yields an extra, low Mr, band on the SDS-polyacrylamide gel that corresponds to that expected for MacA (lane 5) and was identified as such by Western blotting (lane 5′). A control experiment was performed in the absence of immobilized MacB in which Δ20MacA was passed through a Ni2+-agarose column and the flow-through (lane 7), the first and second washes with 100 mm imidazole (lanes 8 and 9, respectively), and the 500 mm imidazole elution (lane 10) were tested for the presence of MacA, which was only found in the flow-through and first wash (lane 7′ and 8′, respectively), establishing that S-tagged MacA does not bind to the column. These results indicate that MacA does not require the N-terminal α-helix, which anchors it to the inner membrane, to interact with MacB. A protein Mr marker was run in lane 6.
FIGURE 2.
FIGURE 2.
MacAB-TolC form a tripartite complex that confers resistance to erythromycin. A, growth curves for E. coli cells, of strain KAM3 (DE3), harboring the plasmids pETDuet (•), pETDuet-MacB (○), pETDuet-MacB/MacA (▾), pETDuet-MacB/TolC (▵), pETDuet-MacB/MacA/TolC (▪) and pETDuet-MacB/gIII-SS-Δ20MacA/TolC (□) grown in the presence of 100 μg/ml erythromycin. B, bar chart showing the extent of inhibition of the growth of E. coli cells in response to 50 μg/ml erythromycin, of strain KAM3(DE3), harboring the plasmids pETDuet (blank), pETDuet-MacB (MacB), pETDuet-MacB/MacA (MacAB) or no plasmid (Wild). For each strain the A600 was determined after growth for 3 h in the absence and presence of erythromycin, and the growth inhibition was determined as the ratio of these measurements. Cells expressing both MacA and MacB suffered less from erythromycin growth inhibition than those expressing only MacB, suggesting that MacA confers elevated resistance to erythromycin on the MacB strain.
FIGURE 3.
FIGURE 3.
Biophysical evidence for MacB dimer formation. A, AUC sedimentation equilibrium profiles of MacB. A representative sedimentation equilibrium profile from one of the runs (two different velocities of the same sample) is shown. Experimental data (dots) and fitted model for a 162.6-kDa particle (solid line) is shown for each. The bottom panel represents the residuals after fitting. B, AUC sedimentation velocity profiles of MacB are consistent with the formation of a stable dimer. The upper panel shows sedimentation profile curves at different time points, and the lower panel presents a c(s) size distribution analysis with solutions of the Lamm equation. The sedimentation coefficient is 6.8 S corresponding to an apparent molecular mass of 160 kDa, consistent with a dimer with about 16 detergent molecules bound. C, mass spectrum of MacB. The charge states corresponding to the peaks are graphed. The mass spectrum indicated a molecular mass for MacB of 145.96 kDa, which is consistent with a dimer.
FIGURE 4.
FIGURE 4.
AFM analyses, AFM imaging of MacB. A, three-dimensional picture of a low magnification image of MacB acquired in air in Tapping Mode with a diamond-like extra tip of resonant frequency ∼300 kHz and spring constant of 40 newtons/m. m and d show particles that belong to the first and second peak in B, respectively. B, frequency distribution of molecular volumes of MacB. The curve indicates a fitted Gaussian function. The m and d peaks correspond to volumes of 118 ± 1 nm3 (n = 1642) and 238 ± 5 nm3 (n = 665), consistent with the monomer and dimer, respectively. C, frequency distribution of molecular volumes of MacB that had been incubated with the nonhydrolysable ATP analogue AMP-PNP. The peaks correspond to volumes of 112 ± 3 nm3 (n = 94) and 218 ± 14 nm3 (n = 116). These data indicate an increase in the dimer:monomer ratio in the presence of AMP-PNP. D, high resolution images of structures where two small particles (m+m) are attached to one another, clearly indicative of dimer formation.
FIGURE 5.
FIGURE 5.
MacA regulates the ATPase activity of MacB. A, time course for the change in Pi concentration, corresponding to the absorbance change of the 2-amino-6-mercapto-7-methylpurine riboside in A, where 2.3 μm MacB was mixed with 1 mm ATP in the absence (upper trace) and presence (lower trace) of an equivalent concentration of MacA. In the absence of MacA, MacB produced a phosphate (Pi) burst, with a rate and amplitude of 0.235 (±0.001) s-1 and 2.20 (±0.01) μm, respectively. MacB did not produce a Pi burst in the presence of MacA. B, steady-state rate of Pi production by MacB as a function of the ATP concentration in the absence (lower curve) and presence (upper curve) of an equivalent concentration of MacA. The data are characterized by Vmax and Km values of 8.9 (±0.7) nmol of ATP/mg MacB/min and 374 (±126) μm, respectively, for MacB alone; and of 12.3 (±0.5) nmol of ATP/mg MacB/min and 72 (±22) μm, respectively, for MacB in the presence of an equivalent concentration of MacA.
FIGURE 6.
FIGURE 6.
MacA increases the capacity of MacB to bind erythromycin. Purified proteins (50 μg of MacA or MacB, or 25 μg of MacA plus 25 μg of MacB) were incubated in the presence of [N-methyl-14C]erythromycin at concentrations as indicated (1, 5, or 10 μm), after which drug binding was measured by rapid filtration. The bars represent the erythromycin bound by MacA (left, black), MacB (middle, light gray), and MacAB (right, dark gray). The data indicate that MacA enhances the binding of erythromycin to MacB.

Similar articles

Cited by

References

    1. Borges-Walmsley, M. I., McKeegan, K. S., and Walmsley, A. R. (2003) Biochem. J. 376 313-338 - PMC - PubMed
    1. Holland, I. B., Schmitt, L., and Young, J. (2005) Mol. Membr. Biol. 22 29-39 - PubMed
    1. Kobayashi, N., Nishino, K., and Yamaguchi, A. (2001) J. Bacteriol. 183 5639-5644 - PMC - PubMed
    1. Touze, T., Eswaran, J., Bokma, E., Koronakis, E., Hughes, C., and Koronakis, V. (2004) Mol. Microbiol. 53 697-706 - PubMed
    1. Tikhonova, E. B., and Zgurskaya, H. I. (2004) J. Biol. Chem. 279 32116-32124 - PubMed

Publication types

MeSH terms

LinkOut - more resources