

Arginyltransferase regulates alpha cardiac actin function, myofibril formation and contractility during heart development
- PMID: 18948421
- PMCID: PMC2582055
- DOI: 10.1242/dev.022723
Arginyltransferase regulates alpha cardiac actin function, myofibril formation and contractility during heart development
Erratum in
- Development. 2008 Dec;135(23):3971
Abstract
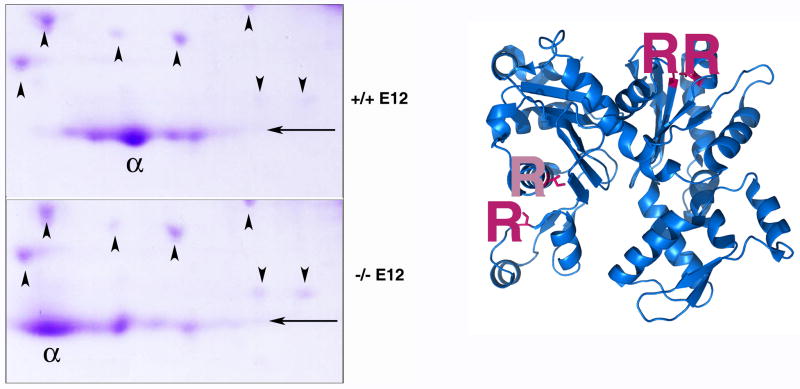
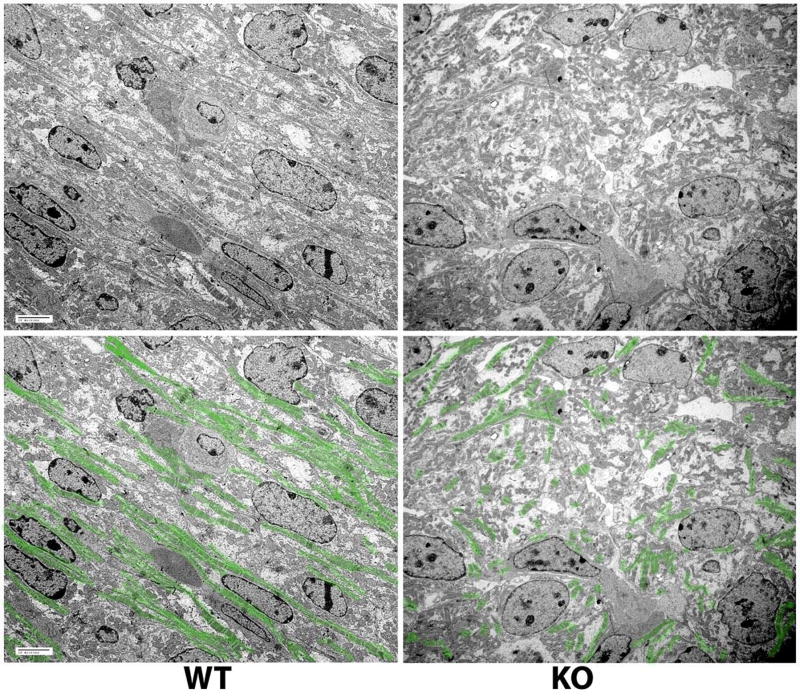
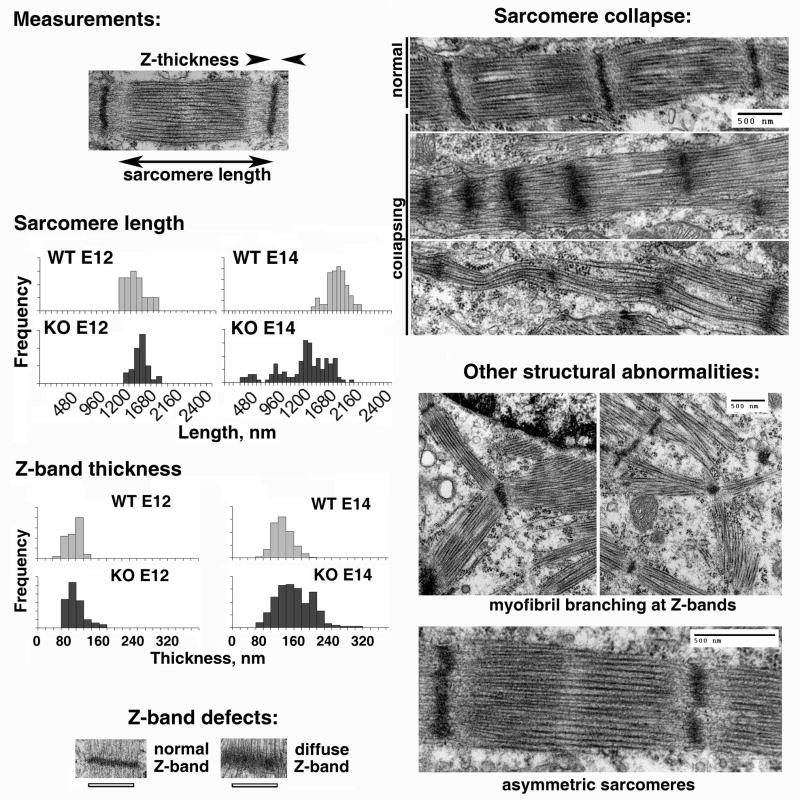
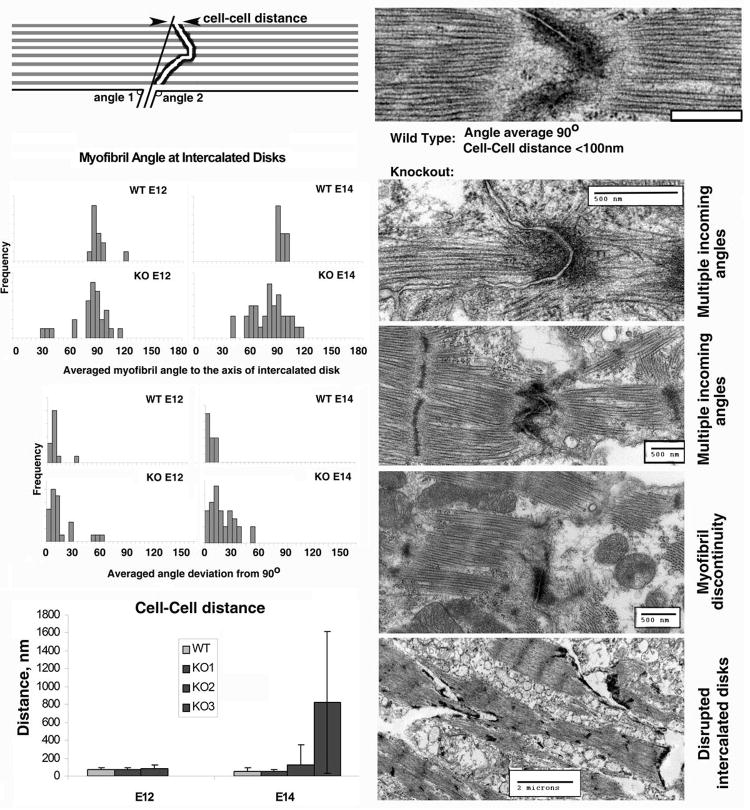
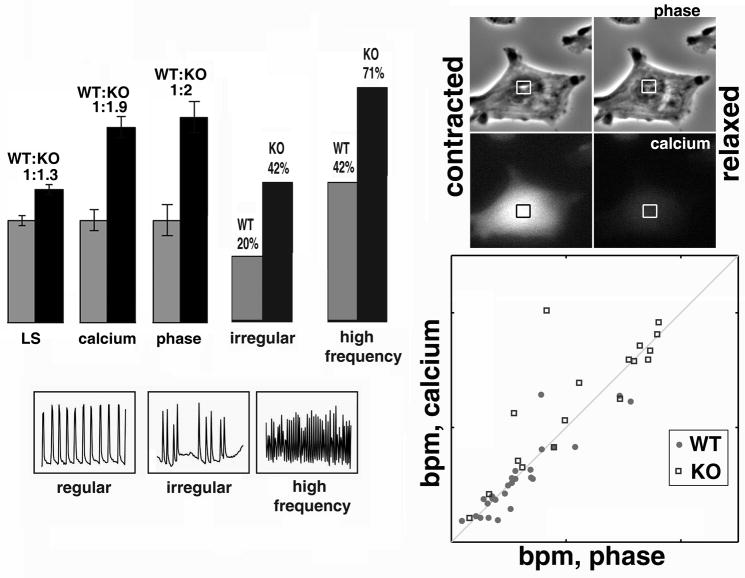
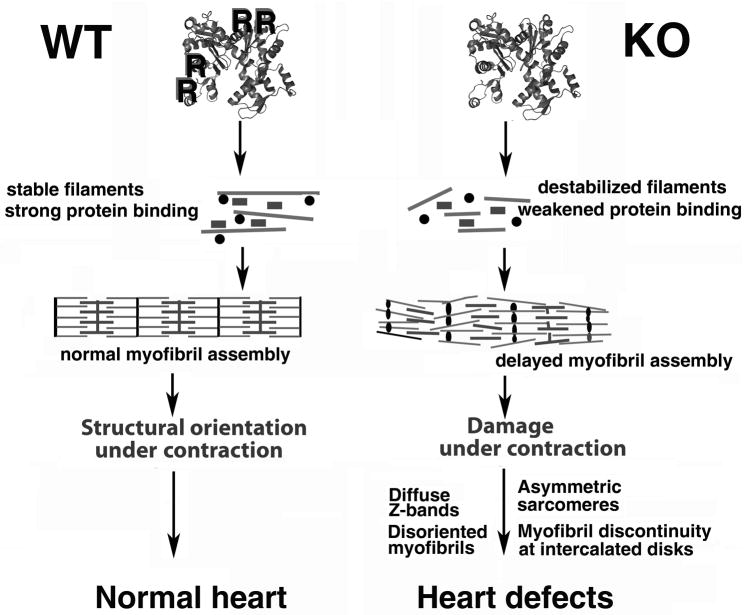
Post-translational arginylation mediated by arginyltransferase (Ate1) is essential for cardiovascular development and angiogenesis in mammals and directly affects myocardium structure in the developing heart. We recently showed that arginylation exerts a number of intracellular effects by modifying proteins involved in the functioning of the actin cytoskeleton and in cell motility. Here, we investigated the role of arginylation in the development and function of cardiac myocytes and their actin-containing structures during embryogenesis. Biochemical and mass spectrometry analyses showed that alpha cardiac actin undergoes arginylation at four sites during development. Ultrastructural analysis of the myofibrils in wild-type and Ate1 knockout mouse hearts showed that the absence of arginylation results in defects in myofibril structure that delay their development and affect the continuity of myofibrils throughout the heart, predicting defects in cardiac contractility. Comparison of cardiac myocytes derived from wild-type and Ate1 knockout mouse embryos revealed that the absence of arginylation results in abnormal beating patterns. Our results demonstrate cell-autonomous cardiac myocyte defects in arginylation knockout mice that lead to severe congenital abnormalities similar to those observed in human disease, and outline a new function of arginylation in the regulation of the actin cytoskeleton in cardiac myocytes.
Figures
Similar articles
-
Arginylation regulates myofibrils to maintain heart function and prevent dilated cardiomyopathy.J Mol Cell Cardiol. 2012 Sep;53(3):333-41. doi: 10.1016/j.yjmcc.2012.05.007. Epub 2012 May 21. J Mol Cell Cardiol. 2012. PMID: 22626847 Free PMC article.
-
Arginylation of beta-actin regulates actin cytoskeleton and cell motility.Science. 2006 Jul 14;313(5784):192-6. doi: 10.1126/science.1129344. Epub 2006 Jun 22. Science. 2006. PMID: 16794040
-
Ate1-mediated posttranslational arginylation affects substrate adhesion and cell migration in Dictyostelium discoideum.Mol Biol Cell. 2019 Feb 15;30(4):453-466. doi: 10.1091/mbc.E18-02-0132. Epub 2018 Dec 26. Mol Biol Cell. 2019. PMID: 30586322 Free PMC article.
-
Protein arginylation, a global biological regulator that targets actin cytoskeleton and the muscle.Anat Rec (Hoboken). 2014 Sep;297(9):1630-6. doi: 10.1002/ar.22969. Anat Rec (Hoboken). 2014. PMID: 25125176 Free PMC article. Review.
-
Post-translational protein arginylation in the normal nervous system and in neurodegeneration.J Neurochem. 2016 Aug;138(4):506-17. doi: 10.1111/jnc.13708. Epub 2016 Jul 5. J Neurochem. 2016. PMID: 27318192 Review.
Cited by
-
Arginylation-dependent regulation of a proteolytic product of talin is essential for cell-cell adhesion.J Cell Biol. 2012 Jun 11;197(6):819-36. doi: 10.1083/jcb.201112129. Epub 2012 Jun 4. J Cell Biol. 2012. PMID: 22665520 Free PMC article.
-
Analyzing N-terminal Arginylation through the Use of Peptide Arrays and Degradation Assays.J Biol Chem. 2016 Sep 30;291(40):20976-20992. doi: 10.1074/jbc.M116.747956. Epub 2016 Aug 10. J Biol Chem. 2016. PMID: 27510035 Free PMC article.
-
tRNAs: cellular barcodes for amino acids.FEBS Lett. 2010 Jan 21;584(2):387-95. doi: 10.1016/j.febslet.2009.11.013. FEBS Lett. 2010. PMID: 19903480 Free PMC article. Review.
-
The N-end rule pathway and regulation by proteolysis.Protein Sci. 2011 Aug;20(8):1298-345. doi: 10.1002/pro.666. Protein Sci. 2011. PMID: 21633985 Free PMC article. Review.
-
Arginylation regulates myofibrils to maintain heart function and prevent dilated cardiomyopathy.J Mol Cell Cardiol. 2012 Sep;53(3):333-41. doi: 10.1016/j.yjmcc.2012.05.007. Epub 2012 May 21. J Mol Cell Cardiol. 2012. PMID: 22626847 Free PMC article.
References
-
- Anderson NG, Anderson NL. Analytical techniques for cell fractions. XXI. Two-dimensional analysis of serum and tissue proteins: multiple isoelectric focusing. Anal Biochem. 1978;85:331–40. - PubMed
-
- Balzi E, Choder M, Chen WN, Varshavsky A, Goffeau A. Cloning and functional analysis of the arginyl-tRNA-protein transferase gene ATE1 of Saccharomyces cerevisiae. J Biol Chem. 1990;265:7464–71. - PubMed
-
- Bongiovanni G, Fissolo S, Barra HS, Hallak ME. Posttranslational arginylation of soluble rat brain proteins after whole body hyperthermia. J Neurosci Res. 1999;56:85–92. - PubMed
-
- Burgess-Cassler A, Johansen JJ, Santek DA, Ide JR, Kendrick NC. Computerized quantitative analysis of coomassie-blue-stained serum proteins separated by two-dimensional electrophoresis. Clin Chem. 1989;35:2297–304. - PubMed
-
- Conti MA, Even-Ram S, Liu C, Yamada KM, Adelstein RS. Defects in Cell Adhesion and the Visceral Endoderm following Ablation of Nonmuscle Myosin Heavy Chain II-A in Mice. J Biol Chem. 2004;279:41263–41266. - PubMed
Publication types
MeSH terms
Substances
Grants and funding
LinkOut - more resources
Full Text Sources
Molecular Biology Databases
