. 2008 Nov 1;181(9):6038-50.
doi: 10.4049/jimmunol.181.9.6038.

Nasal anti-CD3 antibody ameliorates lupus by inducing an IL-10-secreting CD4+ CD25- LAP+ regulatory T cell and is associated with down-regulation of IL-17+ CD4+ ICOS+ CXCR5+ follicular helper T cells

Affiliations

Nasal anti-CD3 antibody ameliorates lupus by inducing an IL-10-secreting CD4+ CD25- LAP+ regulatory T cell and is associated with down-regulation of IL-17+ CD4+ ICOS+ CXCR5+ follicular helper T cells

Henry Yim Wu et al. J Immunol. .

Abstract

Lupus is an Ab-mediated autoimmune disease. One of the potential contributors to the development of systemic lupus erythematosus is a defect in naturally occurring CD4(+)CD25(+) regulatory T cells. Thus, the generation of inducible regulatory T cells that can control autoantibody responses is a potential avenue for the treatment of systemic lupus erythematosus. We have found that nasal administration of anti-CD3 mAb attenuated lupus development as well as arrested ongoing lupus in two strains of lupus-prone mice. Nasal anti-CD3 induced a CD4(+)CD25(-)latency-associated peptide (LAP)(+) regulatory T cell that secreted high levels of IL-10 and suppressed disease in vivo via IL-10- and TFG-beta-dependent mechanisms. Disease suppression also occurred following adoptive transfer of CD4(+)CD25(-)LAP(+) regulatory T cells from nasal anti-CD3-treated animals to lupus-prone mice. Animals treated with nasal anti-CD3 had less glomerulonephritis and diminished levels of autoantibodies as measured by both ELISA and autoantigen microarrays. Nasal anti-CD3 affected the function of CD4(+)ICOS(+)CXCR5(+) follicular helper T cells that are required for autoantibody production. CD4(+)ICOS(+)CXCR5(+) follicular helper T cells express high levels of IL-17 and IL-21 and these cytokines were down-regulated by nasal anti-CD3. Our results demonstrate that nasal anti-CD3 induces CD4(+)CD25(-)LAP(+) regulatory T cells that suppress lupus in mice and that it is associated with down-regulation of T cell help for autoantibody production.


Figures
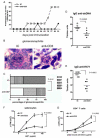
FIGURE 1
FIGURE 1
Nasal anti-CD3 suppresses accelerated lupus in SNF1 mice. A, SNF1 mice (eight per group) received three 5-day courses of 0.5 μg IC or anti-CD3 Ab nasally before immunization with H471 peptide to accelerate lupus development. Proteinuria was measured weekly. This experiment was repeated once with similar results. B, On day 90 following H471 peptide immunization, kidney pathology was examined by PAS. A representative glomerulus was chosen and images were made at ×100 magnification. This experiment was repeated once with similar results. C, Kidneys of all mice nasally treated with IC (left) or anti-CD3 (right) Ab were stained with PAS and graded by light microscopy on a scale of 0 to 4 as follows: 0, no lesions; 1, minor thickening of capillaries; 2, focal and/or diffuse thickening of capillaries in 30-60% of the glomeruli; 3, all capillaries of all glomeruli affected; and 4, sclerosis of glomeruli and numerous tubular casts. Percentages of glomerulonephritis scores in each group are presented as bar charts (p-value derived from Wilcoxon rank-sum test). This experiment was repeated once with similar results. D, Anti-dsDNA and (E) anti-H471 autoantibodies in mouse serum were measured by ELISA. OD450 readings were converted to units by defining a positive SNF1 serum control as 100 U and a negative control as 10 U (p-value derived from t test). Each symbol represents one mouse, and means of each group are represented by cross-bars. F, Splenocytes of IC or anti-CD3 Ab-treated SNF1 mice were cultured with H471 peptide for 96 h (IC vs anti-CD3 at 100 μg/ml, p-value derived from two-way ANOVA test). G, Enriched CD4+ T cells of IC- or anti-CD3 Ab-treated SNF1 mice were stimulated with plate-bound anti-CD3 for 96 h (IC vs anti-CD3 at 1 μg/ml, p-value derived from two-way ANOVA test). Proliferation was measured by thymidine incorporation.
FIGURE 2
FIGURE 2
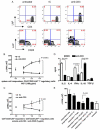
In vitro suppression by CD4+CD25-LAP+ regulatory T cells. A, SNF1 mice received a 5-day course of 0.5 μg IC or anti-CD3 Ab nasally and at 72 h after the last nasal dose cells from CLNs were examined by flow cytometry. Analysis was performed on gated CD4+7-aminoactinomycin D- autofluorescent-negative T cells. Representative dot plots of eight independent experiments are shown here. B, SNF1 mice were nasally treated with a 5-day course of 0.5 μg IC or anti-CD3 Ab before being immunized with H471 peptide. Ten days following immunization, CD4+CD25-LAP+ T cells were sorted from PLNs and cocultured with splenocytes at various ratios in the presence of H471 for 96 h (IC vs anti-CD3 at 1:4 ratio, p-value derived from two-way ANOVA test). C, SNF1 mice were nasally treated with a 5-day course of 0.5 μg IC or anti-CD3 Ab and at 72 h after the last treatment CD4+CD25-LAP+ T cells were sorted from CLNs and cocultured with CD4+CD25-LAP- T cells sorted from PLNs of naive mice at various ratios in the presence of soluble anti-CD3 and anti-CD28 Abs for 96 h (IC vs anti-CD3 at 1:4 ratio, p-value derived from two-way ANOVA test). D, CD4+CD25-LAP+ T cells of IC (open bars) or anti-CD3 (filled bars) nasally treated SNF1 mice were isolated at 72 h after the last treatment and cultured with plate-bound anti-CD3 Ab, and cytokines in culture supernatant were determined. This experiment was repeated four times with similar result (p-values derived from t tests). E, CD4+CD25-LAP+ regulatory T cells of nasal anti-CD3-treated SNF1 mice were cocultured (at 1:1 ratio) with naive CD4+CD25-LAP- responder T cells in the presence of plate-bound anti-CD3 or plate-bound anti-CD3 plus anti-mouse IL-10 or TGF-β-neutralizing Ab or control Ab. Regulatory T cells (bottom chamber) and T responder cells (top chamber) were also cultured in a transwell system with soluble anti-CD3 and anti-CD28. Proliferation represents responder T cells (p-value derived from two-way ANOVA test). This experiment was repeated four times and a representative experiment is shown here.
FIGURE 3
FIGURE 3
Transfer of disease suppression by LAP+ regulatory T cells. A, CD4+ T cells were negatively selected from CLNs of SNF1 mice (eight per group) at 72 h after the last nasal treatment (a 5-day course of 0.5 μg) of IC or anti-CD3 Ab. Whole CD4+ or LAP-depleted CD4+ T cells (2 × 10⁶/mouse) were adoptively transferred to H471 peptide-sensitized SNF1 mice (four per group). Proteinuria of recipients was estimated weekly. This experiment was repeated once with similar results. B, Kidneys of all recipients were stained with PAS and graded by light microscopy on a scale of 0-4 (as explained in Fig. 1C) (p-values derived from Wilcoxon rank-sum tests). This experiment was repeated once with similar results. C, On day 90 following adoptive transfer, IgG anti-dsDNA autoantibodies in serum of recipients were measured by ELISA. OD450 readings were converted to units by defining a positive SNF1 serum control as 100 U and a negative control as 10 U (p-value derived from t test). Each symbol represents one mouse. This experiment was repeated once with similar results.
FIGURE 4
FIGURE 4
IL-10- and TGF-β-dependent in vivo suppression. A, CD4+ T cells were negatively selected from CLNs of SNF1 mice (eight mice) at 72 h after the last nasal treatment (one 5-day course of 0.5 μg) with anti-CD3. Whole CD4+ or LAP-depleted CD4+ T cells (2 × 10⁶/mouse) or PBS was adoptively transferred to H471 peptide-sensitized SNF1 mice (four per group). Mouse recipients were injected five times with rat IgG1 control or anti-IL-10 or anti-TGF-β-neutralizing Ab. Proteinuria in recipients was estimated weekly. This experiment was repeated once with similar results. B, On day 35 following H471 peptide immunization, kidney pathology was examined by PAS (top panel). A representative glomerulus was chosen and images were made at ×100 magnification. Frozen kidney sections of SNF1 recipients were stained with PE Alexa Fluor 594 donkey anti-mouse IgG (H+L) Ab (middle panel) or FITC Alexa Fluor 488 goat anti-mouse C3 Ab (bottom panel). Images were taken at ×40 magnification. Representative images are shown here. This experiment was repeated once with similar results. C, Kidneys of all recipients were stained with PAS and graded by light microscopy on a scale of 0-4 (as explained in Fig. 1C) (p-values derived from Wilcoxon rank-sum tests). This experiment was repeated once with similar results. D, On day 35 following adoptive transfer, IgG anti-dsDNA and (E) anti-H471 autoantibodies in serum of recipients were measured by ELISA. OD450 readings were converted to units by defining a positive SNF1 serum control as 100 U and a negative control as 10 U (p-value derived from t test). This experiment was repeated once with similar results.
FIGURE 5
FIGURE 5
Down-regulation of function of, and IL-17 and IL-21 expression by, follicular helper T cells following nasal anti-CD3. A, Female SNF1 mice (three per group) at 7 mo old with persistent proteinuria were nasally dosed with six 5-day courses of 0.5 μg IC or anti-CD3 at 1-wk intervals. Fifteen days after the last nasal treatment, CD4+ICOS+CXCR5+ follicular helper T cells were sorted from splenocytes and cocultured with autologous CD19+ B cells for 5 days. Supernatant was collected at the end of the culture and used in ELISA for detection of total IgG, IgG1, and IgG2a anti-dsDNA Abs. OD450 readings were converted to units by defining a positive SNF1 serum control as 100 U and a negative control as 10 U (p-value derived from t test). B, Sorted CD4+ICOS+CXCR5+ follicular helper T cells were stimulated with PMA and ionomycin in the presence of GolgiStop for 5 h before RNA was extracted for quantitative PCR (p-value derived from t test). C, CD4+ICOS+CXCR5+ follicular helper T cells were sorted from spleens of IC or anti-CD3 nasally treated mice or age-matched untreated controls and stimulated with PMA and ionomycin in the presence of GolgiStop before being fixed, permeablized, and stained with PE-conjugated IL-17 Ab. Percentages of IL-17+ cells are shown in the dot plot (p-value derived from t test). Each symbol represents one mouse.
FIGURE 6
FIGURE 6
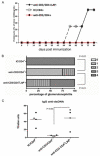
Nasal anti-CD3 ameliorates spontaneous lupus. A, BWF1 mice (eight per group) at 6 mo old with persistent proteinuria were nasally dosed with six 5-day courses of 0.5 μg IC or anti-CD3. Mice were followed for 90 days after treatment and the percentage of survival in each treatment group was recorded weekly. This experiment was repeated once with similar results. B, BWF1 mouse kidneys were collected on day 50 following the last nasal treatment, and kidney pathology was examined by PAS (top panel). A representative glomerulus was chosen and images were made at ×100 magnification. Frozen kidney sections of BWF1 mice were stained with FITC Alexa Fluor 488 donkey anti-mouse IgG (H+L) Ab (middle panel) or FITC Alexa Fluor 488 goat anti-mouse C3 Ab (bottom panel). Images were taken at ×100 or ×10 magnification, respectively. Representative images are shown here. C, Glomerulonephritis was graded on a scale of 0-4 (as explained in Fig. 1C) (p-value derived from Wilcoxon rank-sum test). D, BWF1 mouse serum was used in ELISA for the detection of IgG anti-dsDNA. OD450 readings were converted to units by defining a positive BWF1 serum control as 100 U and a negative control as 10 U (p-value derived from t test).
FIGURE 7
FIGURE 7
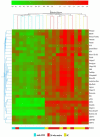
Heat map of lupus-associated autoantigen microarray. Serum of BWF1 mice nasally treated with IC (six mice, yellow bars) or anti-CD3 Ab (eight mice, blue bars) was diluted 1/200 before being used in autoantigen microarray. Serum of 9-mo-old untreated BWF1 mice with spontaneous lupus (seven mice, red bars) was used as controls. IgG reactivity to 32 of 40 lupus-associated autoantigens differed significantly between the three groups and are thus shown here.
FIGURE 8
FIGURE 8
Levels of serum reactivity to lupus-associated autoantigens. BWF1 serum IgG Abs to the 32 lupus-associated autoantigens were categorized into high (A), medium (B), and low (C) reactivity according to the intensity of the fluorescent signal. We used a goat anti-mouse IgG capture Ab as the positive control.

Similar articles

Cited by

References

    1. Ravirajan CT, Rahman MA, Papadaki L, Griffiths MH, Kalsi J, Martin AC, Ehrenstein MR, Latchman DS, Isenberg DA. Genetic, structural, and functional properties of an IgG DNA-binding monoclonal antibody from a lupus patient with nephritis. Eur. J. Immunol. 1998;28:339–350. - PubMed
    1. Ehrenstein MR, Katz DR, Griffiths MH, Papadaki L, Winkler TH, Kalden JR, Isenberg DA. Human IgG anti-DNA antibodies deposit in kidneys and induce proteinuria in SCID mice. Kidney Int. 1995;48:705–711. - PubMed
    1. Okamura M, Kanayama Y, Amastu K, Negoro N, Kohda S, Takeda T, Inoue T. Significance of enzyme linked immunosorbent assay (ELISA) for antibodies to double stranded and single stranded DNA in patients with lupus nephritis: correlation with severity of renal histology. Ann. Rheum. Dis. 1993;52:14–20. - PMC - PubMed
    1. Rahman A. Autoantibodies, lupus, and the science of sabotage. Rheumatology. 2004;43:1326–1336. - PubMed
    1. Walker LS, Gulbranson-Judge A, Flynn S, Brocker T, Lane PJ. Co-stimulation and selection for T-cell help for germinal centres: the role of CD28 and OX40. Immunol. Today. 2000;21:333–337. - PubMed

Publication types

MeSH terms