Phospholipase A2 reduction ameliorates cognitive deficits in a mouse model of Alzheimer's disease
- PMID: 18931664
- PMCID: PMC2597064
- DOI: 10.1038/nn.2213
Phospholipase A2 reduction ameliorates cognitive deficits in a mouse model of Alzheimer's disease
Abstract
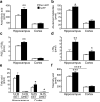
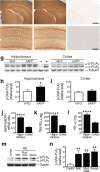
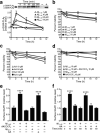
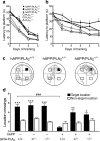
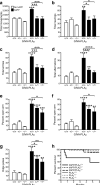
Neuronal expression of familial Alzheimer's disease-mutant human amyloid precursor protein (hAPP) and hAPP-derived amyloid-beta (Abeta) peptides causes synaptic dysfunction, inflammation and abnormal cerebrovascular tone in transgenic mice. Fatty acids may be involved in these processes, but their contribution to Alzheimer's disease pathogenesis is uncertain. We used a lipidomics approach to generate a broad profile of fatty acids in brain tissues of hAPP-expressing mice and found an increase in arachidonic acid and its metabolites, suggesting increased activity of the group IV isoform of phospholipase A(2) (GIVA-PLA(2)). The levels of activated GIVA-PLA(2) in the hippocampus were increased in individuals with Alzheimer's disease and in hAPP mice. Abeta caused a dose-dependent increase in GIVA-PLA(2) phosphorylation in neuronal cultures. Inhibition of GIVA-PLA(2) diminished Abeta-induced neurotoxicity. Genetic ablation or reduction of GIVA-PLA(2) protected hAPP mice against Abeta-dependent deficits in learning and memory, behavioral alterations and premature mortality. Inhibition of GIVA-PLA(2) may be beneficial in the treatment and prevention of Alzheimer's disease.
Figures

Similar articles
-
Phospholipase d2 ablation ameliorates Alzheimer's disease-linked synaptic dysfunction and cognitive deficits.J Neurosci. 2010 Dec 8;30(49):16419-28. doi: 10.1523/JNEUROSCI.3317-10.2010. J Neurosci. 2010. PMID: 21147981 Free PMC article.
-
The role of cytosolic phospholipase A2 α in amyloid precursor protein induction by amyloid beta1-42 : implication for neurodegeneration.J Neurochem. 2015 Mar;132(5):559-71. doi: 10.1111/jnc.13012. Epub 2015 Feb 3. J Neurochem. 2015. PMID: 25533654
-
Minocycline attenuates neuronal cell death and improves cognitive impairment in Alzheimer's disease models.Neuropsychopharmacology. 2007 Nov;32(11):2393-404. doi: 10.1038/sj.npp.1301377. Epub 2007 Apr 4. Neuropsychopharmacology. 2007. PMID: 17406652
-
Phospholipase A2 and arachidonic acid in Alzheimer's disease.Biochim Biophys Acta. 2010 Aug;1801(8):784-90. doi: 10.1016/j.bbalip.2010.05.013. Epub 2010 May 27. Biochim Biophys Acta. 2010. PMID: 20553961 Free PMC article. Review.
-
Transgenic animal models for Alzheimer's disease.Ann N Y Acad Sci. 1993 Sep 24;695:217-23. doi: 10.1111/j.1749-6632.1993.tb23055.x. Ann N Y Acad Sci. 1993. PMID: 8239285 Review.
Cited by
-
α-Synuclein-induced synapse damage in cultured neurons is mediated by cholesterol-sensitive activation of cytoplasmic phospholipase A2.Biomolecules. 2015 Mar 9;5(1):178-93. doi: 10.3390/biom5010178. Biomolecules. 2015. PMID: 25761116 Free PMC article.
-
Neurotoxicity of amyloid β-protein: synaptic and network dysfunction.Cold Spring Harb Perspect Med. 2012 Jul;2(7):a006338. doi: 10.1101/cshperspect.a006338. Cold Spring Harb Perspect Med. 2012. PMID: 22762015 Free PMC article. Review.
-
Modulation of Cytosolic Phospholipase A2 as a Potential Therapeutic Strategy for Alzheimer's Disease.J Alzheimers Dis Rep. 2023 Dec 29;7(1):1395-1426. doi: 10.3233/ADR-230075. eCollection 2023. J Alzheimers Dis Rep. 2023. PMID: 38225969 Free PMC article.
-
Multi-dimensional mass spectrometry-based shotgun lipidomics and the altered lipids at the mild cognitive impairment stage of Alzheimer's disease.Biochim Biophys Acta. 2010 Aug;1801(8):774-83. doi: 10.1016/j.bbalip.2010.01.010. Epub 2010 Feb 1. Biochim Biophys Acta. 2010. PMID: 20117236 Free PMC article. Review.
-
Lipid metabolism and Alzheimer's disease: clinical evidence, mechanistic link and therapeutic promise.FEBS J. 2023 Mar;290(6):1420-1453. doi: 10.1111/febs.16344. Epub 2022 Jan 18. FEBS J. 2023. PMID: 34997690 Free PMC article. Review.
References
-
- Palop JJ, Chin J, Mucke L. A network dysfunction perspective on neurodegenerative diseases. Nature. 2006;443:768–773. - PubMed
-
- Menard C, Patenaude C, Massicotte G. Phosphorylation of AMPA receptor subunits is differentially regulated by phospholipase A2 inhibitors. Neurosci. Lett. 2005;389:51. - PubMed
-
- Phillis JW, Horrocks LA, Farooqui AA. Cyclooxygenases, lipoxygenases, and epoxygenases in CNS: Their role and involvement in neurological disorders. Brain Res. Brain Res. Rev. 2006;52:201–243. - PubMed
Publication types
MeSH terms
Substances
Grants and funding
- R01 AG011385/AG/NIA NIH HHS/United States
- NS041787/NS/NINDS NIH HHS/United States
- F32 AG028233/AG/NIA NIH HHS/United States
- R01 NS041787-07/NS/NINDS NIH HHS/United States
- R01 NS041787/NS/NINDS NIH HHS/United States
- CO6RR018928/CO/NCI NIH HHS/United States
- R21 AG024447/AG/NIA NIH HHS/United States
- AG011385/AG/NIA NIH HHS/United States
- R37 AG011385-15/AG/NIA NIH HHS/United States
- DK 054741/DK/NIDDK NIH HHS/United States
- AG022074/AG/NIA NIH HHS/United States
- P01 AG022074-06/AG/NIA NIH HHS/United States
- P01 AG022074/AG/NIA NIH HHS/United States
- AG028233/AG/NIA NIH HHS/United States
- R37 AG011385/AG/NIA NIH HHS/United States
- C06 RR018928/RR/NCRR NIH HHS/United States
LinkOut - more resources
Full Text Sources
Other Literature Sources
Medical
Molecular Biology Databases

