

Mechanisms of resistance to 5-aza-2'-deoxycytidine in human cancer cell lines
- PMID: 18931345
- PMCID: PMC2628372
- DOI: 10.1182/blood-2008-02-140038
Mechanisms of resistance to 5-aza-2'-deoxycytidine in human cancer cell lines
Abstract
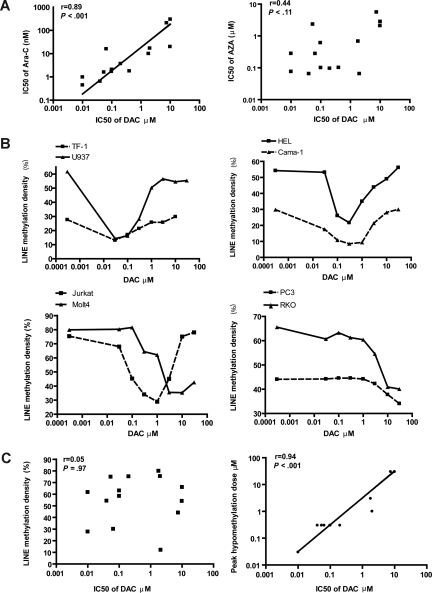
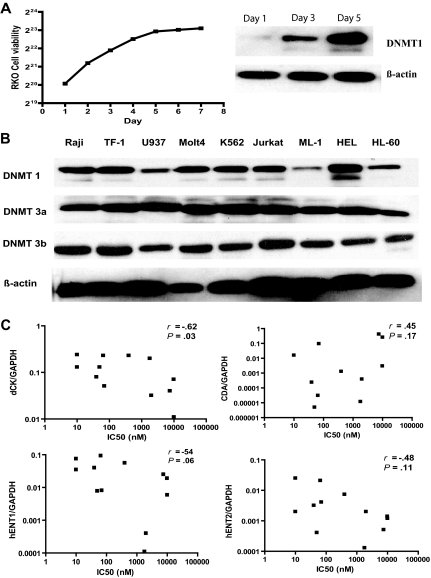
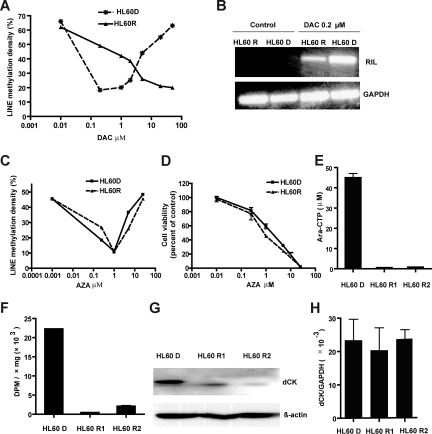
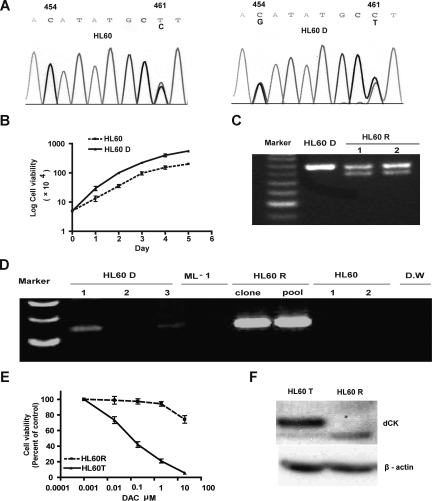
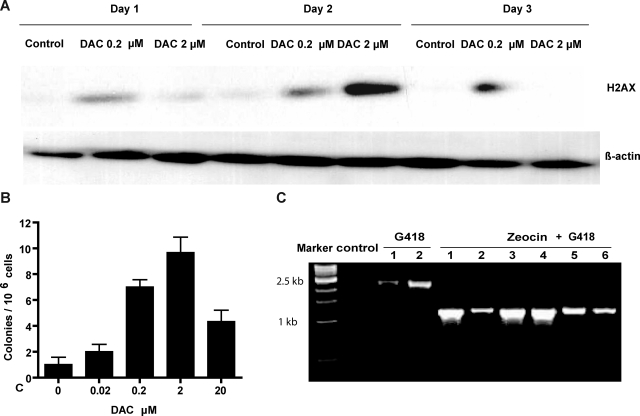
5-aza-2'-deoxycytidine (DAC) is approved for the treatment of myelodysplastic syndromes, but resistance to this agent is common. In search for mechanisms of resistance, we measured the half maximal (50%) inhibitory concentration (IC(50)) of DAC and found it differed 1000-fold among a panel of cancer cell lines. The IC(50) was correlated with the doses of DAC that induced the most hypomethylation of long interspersed nuclear elements (LINE; R = 0.94, P < .001), but not with LINE methylation or DNA methyltransferase 1 (DNMT1), 3a, and 3b expression at baseline. Sensitivity to DAC showed a low correlation (R = 0.44, P = .11) to that of 5-azacytidine (AZA), but a good correlation to that of cytarabine (Ara-C; R = 0.89, P < .001). The 5 cell lines most resistant to DAC had a combination of low dCK, hENT1, and 2 transporters, and high cytosine deaminase. In an HL60 clone, resistance to DAC could be rapidly induced by drug exposure and was related to a switch from heterozygous to homozygous mutation of DCK. Transfection of wild-type DCK restored DAC sensitivity. DAC induced DNA breaks as evidenced by H2AX phosphorylation and increased homologous recombination rates by 7- to 10-fold. These results suggest that in vitro resistance to DAC can be explained by insufficient incorporation into DNA.
Figures
Similar articles
-
Effect of cytarabine and decitabine in combination in human leukemic cell lines.Clin Cancer Res. 2007 Jul 15;13(14):4225-32. doi: 10.1158/1078-0432.CCR-06-2762. Clin Cancer Res. 2007. PMID: 17634552
-
Combination of azacytidine and curcumin is a potential alternative in decitabine-resistant colorectal cancer cells with attenuated deoxycytidine kinase.Biochem Biophys Res Commun. 2021 Nov 12;578:157-162. doi: 10.1016/j.bbrc.2021.09.041. Epub 2021 Sep 22. Biochem Biophys Res Commun. 2021. PMID: 34571370
-
Adult T-cell leukemia-lymphoma acquires resistance to DNA demethylating agents through dysregulation of enzymes involved in pyrimidine metabolism.Int J Cancer. 2022 Apr 1;150(7):1184-1197. doi: 10.1002/ijc.33901. Epub 2021 Dec 29. Int J Cancer. 2022. PMID: 34913485 Free PMC article.
-
Decitabine: 2'-deoxy-5-azacytidine, Aza dC, DAC, dezocitidine, NSC 127716.Drugs R D. 2003;4(3):179-84. doi: 10.2165/00126839-200304030-00007. Drugs R D. 2003. PMID: 12757405 Review.
-
Pharmacological approach for optimization of the dose schedule of 5-Aza-2'-deoxycytidine (Decitabine) for the therapy of leukemia.Leukemia. 1997 Feb;11(2):175-80. doi: 10.1038/sj.leu.2400550. Leukemia. 1997. PMID: 9009076 Review.
Cited by
-
Azacitidine: a review of its use in the management of myelodysplastic syndromes/acute myeloid leukaemia.Drugs. 2012 May 28;72(8):1111-36. doi: 10.2165/11209430-000000000-00000. Drugs. 2012. PMID: 22571445 Review.
-
Epigenetic Reprogramming for Targeting IDH-Mutant Malignant Gliomas.Cancers (Basel). 2019 Oct 22;11(10):1616. doi: 10.3390/cancers11101616. Cancers (Basel). 2019. PMID: 31652645 Free PMC article. Review.
-
Establishment and molecular characterization of decitabine-resistant K562 cells.J Cell Mol Med. 2019 May;23(5):3317-3324. doi: 10.1111/jcmm.14221. Epub 2019 Feb 22. J Cell Mol Med. 2019. PMID: 30793488 Free PMC article.
-
[Research Progress of Epigenetics in Pathogenesis and Treatment of Malignant Tumors].Zhongguo Fei Ai Za Zhi. 2020 Feb 20;23(2):91-100. doi: 10.3779/j.issn.1009-3419.2020.02.04. Zhongguo Fei Ai Za Zhi. 2020. PMID: 32093453 Free PMC article. Review. Chinese.
-
Outcomes after induction chemotherapy in patients with acute myeloid leukemia arising from myelodysplastic syndrome.Cancer. 2011 Apr 1;117(7):1463-9. doi: 10.1002/cncr.25598. Epub 2010 Nov 8. Cancer. 2011. PMID: 21425147 Free PMC article.
References
-
- Sollars VE. Epigenetic modification as an enabling mechanism for leukemic transformation. Front Biosci. 2005;10:1635–1646. - PubMed
-
- Villa R, De Santis F, Gutierrez A, Minucci S, Pelicci PG, Di Croce L. Epigenetic gene silencing in acute promyelocytic leukemia. Biochem Pharmacol. 2004;68:1247–1254. - PubMed
-
- Mizuno S, Chijiwa T, Okamura T, et al. Expression of DNA methyltransferases DNMT1, 3A, and 3B in normal hematopoiesis and in acute and chronic myelogenous leukemia. Blood. 2001;97:1172–1179. - PubMed
-
- Issa JP. DNA methylation as a therapeutic target in cancer. Clin Cancer Res. 2007;13:1634–1637. - PubMed
-
- Qin T, Youssef EM, Jelinek J, et al. Effect of cytarabine and decitabine in combination in human leukemic cell lines. Clin Cancer Res. 2007;13:4225–4232. - PubMed
Publication types
MeSH terms
Substances
Grants and funding
LinkOut - more resources
Full Text Sources
Other Literature Sources
