

PlasmoDraft: a database of Plasmodium falciparum gene function predictions based on postgenomic data
- PMID: 18925948
- PMCID: PMC2605471
- DOI: 10.1186/1471-2105-9-440
PlasmoDraft: a database of Plasmodium falciparum gene function predictions based on postgenomic data
Abstract
Background: Of the 5,484 predicted proteins of Plasmodium falciparum, the main causative agent of malaria, about 60% do not have sufficient sequence similarity with proteins in other organisms to warrant provision of functional assignments. Non-homology methods are thus needed to obtain functional clues for these uncharacterized genes.
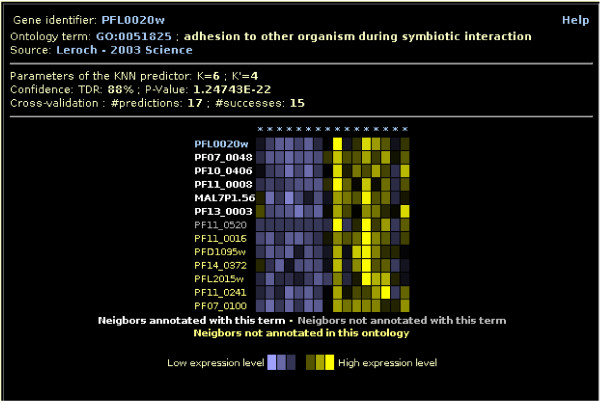
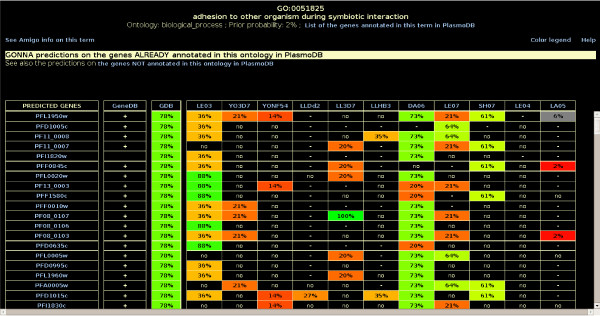
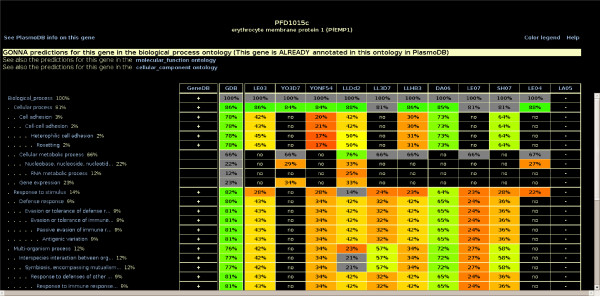
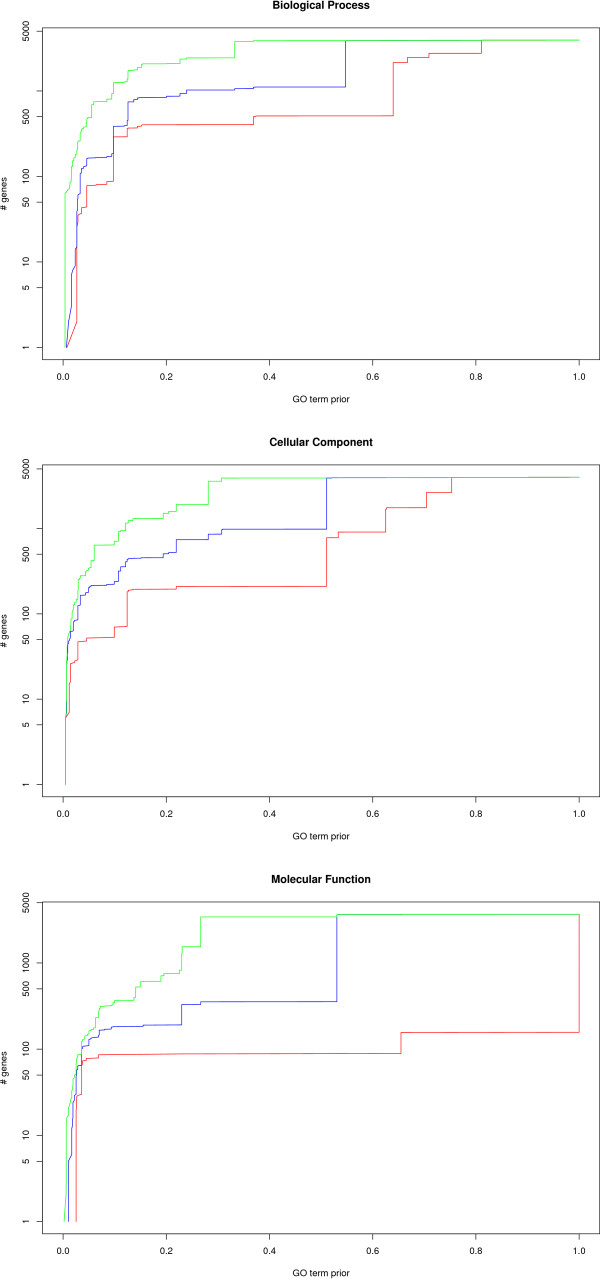
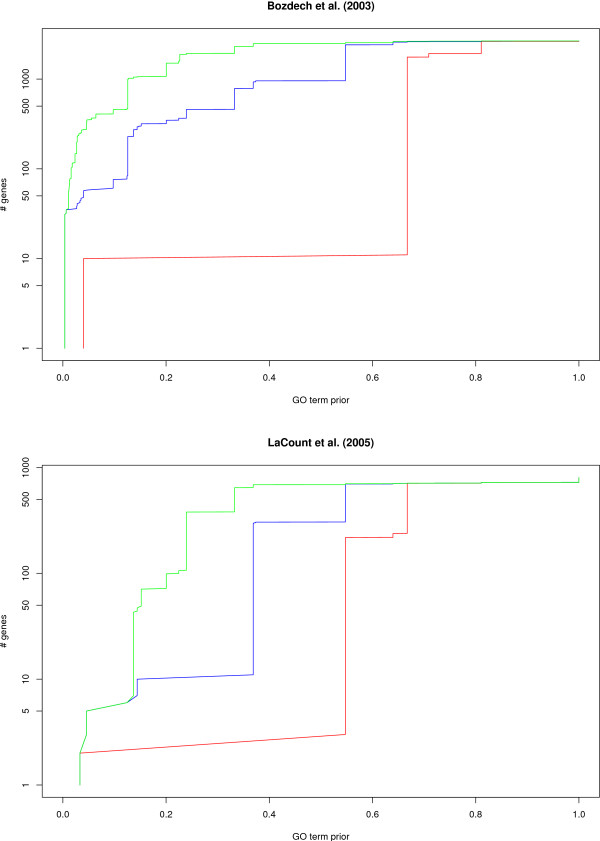
Results: We present PlasmoDraft http://atgc.lirmm.fr/PlasmoDraft/, a database of Gene Ontology (GO) annotation predictions for P. falciparum genes based on postgenomic data. Predictions of PlasmoDraft are achieved with a Guilt By Association method named Gonna. This involves (1) a predictor that proposes GO annotations for a gene based on the similarity of its profile (measured with transcriptome, proteome or interactome data) with genes already annotated by GeneDB; (2) a procedure that estimates the confidence of the predictions achieved with each data source; (3) a procedure that combines all data sources to provide a global summary and confidence estimate of the predictions. Gonna has been applied to all P. falciparum genes using most publicly available transcriptome, proteome and interactome data sources. Gonna provides predictions for numerous genes without any annotations. For example, 2,434 genes without any annotations in the Biological Process ontology are associated with specific GO terms (e.g. Rosetting, Antigenic variation), and among these, 841 have confidence values above 50%. In the Cellular Component and Molecular Function ontologies, 1,905 and 1,540 uncharacterized genes are associated with specific GO terms, respectively (740 and 329 with confidence value above 50%).
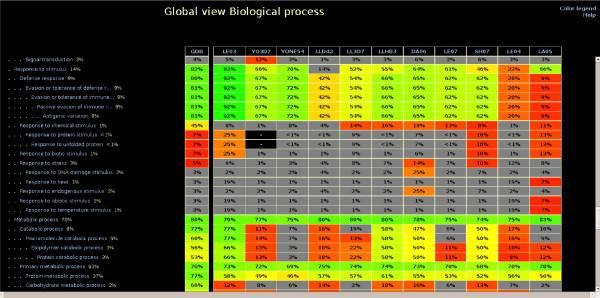
Conclusion: All predictions along with their confidence values have been compiled in PlasmoDraft, which thus provides an extensive database of GO annotation predictions that can be achieved with these data sources. The database can be accessed in different ways. A global view allows for a quick inspection of the GO terms that are predicted with high confidence, depending on the various data sources. A gene view and a GO term view allow for the search of potential GO terms attached to a given gene, and genes that potentially belong to a given GO term.
Figures
Similar articles
-
PFP: Automated prediction of gene ontology functional annotations with confidence scores using protein sequence data.Proteins. 2009 Feb 15;74(3):566-82. doi: 10.1002/prot.22172. Proteins. 2009. PMID: 18655063
-
Detection of new protein domains using co-occurrence: application to Plasmodium falciparum.Bioinformatics. 2009 Dec 1;25(23):3077-83. doi: 10.1093/bioinformatics/btp560. Epub 2009 Sep 28. Bioinformatics. 2009. PMID: 19786484
-
AVID: an integrative framework for discovering functional relationships among proteins.BMC Bioinformatics. 2005 Jun 1;6:136. doi: 10.1186/1471-2105-6-136. BMC Bioinformatics. 2005. PMID: 15929793 Free PMC article.
-
Ontology annotation: mapping genomic regions to biological function.Curr Opin Chem Biol. 2007 Feb;11(1):4-11. doi: 10.1016/j.cbpa.2006.11.039. Epub 2007 Jan 5. Curr Opin Chem Biol. 2007. PMID: 17208035 Review.
-
Gene Ontology annotation status of the fission yeast genome: preliminary coverage approaches 100%.Yeast. 2006 Oct 15;23(13):913-9. doi: 10.1002/yea.1420. Yeast. 2006. PMID: 17072883 Review.
Cited by
-
Identifying novel cell cycle proteins in Apicomplexa parasites through co-expression decision analysis.PLoS One. 2014 May 19;9(5):e97625. doi: 10.1371/journal.pone.0097625. eCollection 2014. PLoS One. 2014. PMID: 24841368 Free PMC article.
-
Shared molecular strategies of the malaria parasite P. falciparum and the human virus HIV-1.Mol Cell Proteomics. 2011 Oct;10(10):M111.009035. doi: 10.1074/mcp.M111.009035. Epub 2011 May 17. Mol Cell Proteomics. 2011. PMID: 21586753 Free PMC article.
-
Comparative Genomics and Systems Biology of Malaria Parasites Plasmodium.Curr Bioinform. 2012 Dec 1;7(4):10.2174/157489312803900965. doi: 10.2174/157489312803900965. Curr Bioinform. 2012. PMID: 24298232 Free PMC article.
-
Difference in gene duplicability may explain the difference in overall structure of protein-protein interaction networks among eukaryotes.BMC Evol Biol. 2010 Nov 18;10:358. doi: 10.1186/1471-2148-10-358. BMC Evol Biol. 2010. PMID: 21087510 Free PMC article.
-
MaGnET: Malaria Genome Exploration Tool.Bioinformatics. 2013 Sep 15;29(18):2350-2. doi: 10.1093/bioinformatics/btt384. Epub 2013 Jul 27. Bioinformatics. 2013. PMID: 23894142 Free PMC article.
References
-
- Gardner M, Hall N, Fung E, White O, Berriman M, Hyman R, Carlton J, Pain A, Nelson K, Bowman S, Paulson I, James K, Eisen J, Rutherford K, Salzberg S, Craig A, Kyes S, Chan M, None V, Shallom S, Suh B, Peterson J, Angiuoli S, Pertea M, Allen J, Selengut J, Haft D, Mather M, Vaidya A, Martin D, Fairlamb A, Fraunholz M, Roos D, Ralph S, McFadden G, Cummings L, Subramanian G, Mungall C, Venter J, Carucci D, Hoffman S, Newbold C, Davis R, Fraser C, Barrell B. Genome sequence of the human malaria parasite Plasmodium falciparum. Nature. 2002;419:498–511. doi: 10.1038/nature01097. - DOI - PMC - PubMed
-
- Altschul S, Gish W, Miller W, Myers E, Lipman D. Basic local alignment search tool. J Mol Biol. 1990;215:403–410. - PubMed
Publication types
MeSH terms
Substances
LinkOut - more resources
Full Text Sources
