

Encoding intensity in ventral cochlear nucleus following acoustic trauma: implications for loudness recruitment
- PMID: 18855070
- PMCID: PMC2644394
- DOI: 10.1007/s10162-008-0142-y
Encoding intensity in ventral cochlear nucleus following acoustic trauma: implications for loudness recruitment
Abstract
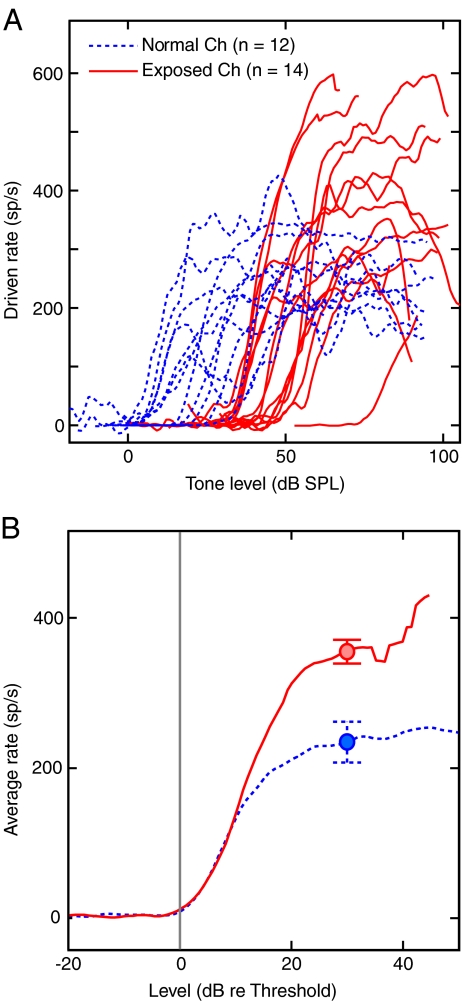
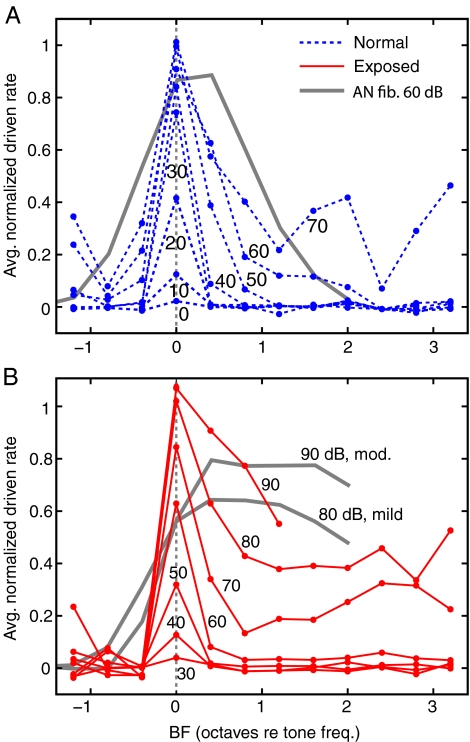
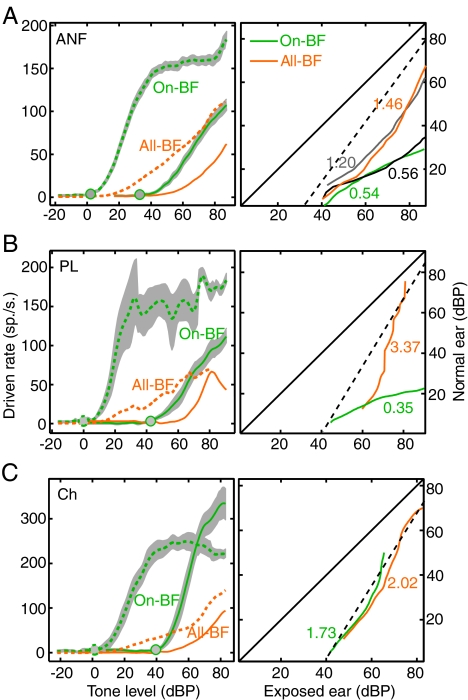
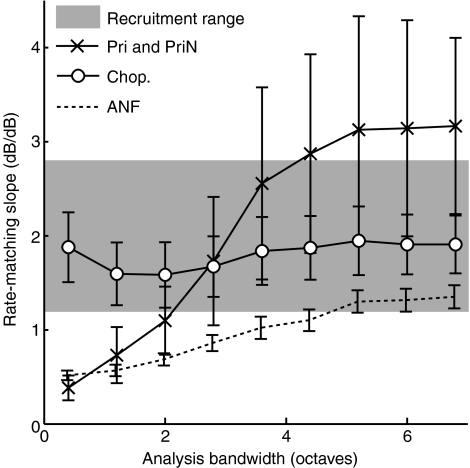
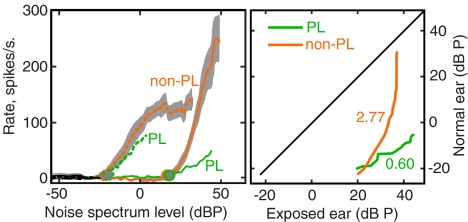
Loudness recruitment, an abnormally rapid growth of perceived loudness with sound level, is a common symptom of sensorineural hearing loss. Following acoustic trauma, auditory-nerve rate responses are reduced, and rate grows more slowly with sound level, which seems inconsistent with recruitment (Heinz et al., J. Assoc. Res. Otolaryngol. 6:91-105, 2005). However, rate-level functions (RLFs) in the central nervous system may increase in either slope or saturation value following trauma (e.g., Salvi et al., Hear. Res. 147:261-274, 2000), suggesting that recruitment may arise from central changes. In this paper, we studied RLFs of neurons in ventral cochlear nucleus (VCN) of the cat after acoustic trauma. Trauma did not change the general properties of VCN neurons, and the usual VCN functional classifications remained valid (chopper, primary-like, onset, etc.). After trauma, non-primary-like neurons, most noticeably choppers, exhibited elevated maximum discharge rates and steeper RLFs for frequencies at and near best frequency (BF). Primary-like neurons showed the opposite changes. To relate the neurons' responses to recruitment, rate-balance functions were computed; these show the sound level required to give equal rates in a normal and a traumatized ear and are analogous to loudness balance functions that show the sound levels giving equal perceptual loudness in the two ears of a monaurally hearing-impaired person. The rate-balance functions showed recruitment-like steepening of their slopes in non-primary-like neurons in all conditions. However, primary-like neurons showed recruitment-like behavior only when rates were summated across neurons of all BFs. These results suggest that the non-primary-like, especially chopper, neurons may be the most peripheral site of the physiological changes in the brain that underlie recruitment.
Figures
Comment in
-
Recruitment of neurons and loudness. Commentary on "Encoding intensity in ventral cochlear nucleus following acoustic trauma: implications for loudness recruitment" by Cai et al. J. Assoc. Res. Otolaryngol. DOI: 10.1007/s10162-008-0142-y.J Assoc Res Otolaryngol. 2009 Mar;10(1):1-4. doi: 10.1007/s10162-009-0156-0. Epub 2009 Jan 22. J Assoc Res Otolaryngol. 2009. PMID: 19159978 Free PMC article. No abstract available.
Similar articles
-
Recruitment of neurons and loudness. Commentary on "Encoding intensity in ventral cochlear nucleus following acoustic trauma: implications for loudness recruitment" by Cai et al. J. Assoc. Res. Otolaryngol. DOI: 10.1007/s10162-008-0142-y.J Assoc Res Otolaryngol. 2009 Mar;10(1):1-4. doi: 10.1007/s10162-009-0156-0. Epub 2009 Jan 22. J Assoc Res Otolaryngol. 2009. PMID: 19159978 Free PMC article. No abstract available.
-
Auditory-nerve rate responses are inconsistent with common hypotheses for the neural correlates of loudness recruitment.J Assoc Res Otolaryngol. 2005 Jun;6(2):91-105. doi: 10.1007/s10162-004-5043-0. Epub 2005 Jun 10. J Assoc Res Otolaryngol. 2005. PMID: 15952047 Free PMC article.
-
Dynamic range of neural rate responses in the ventral cochlear nucleus of awake cats.J Neurophysiol. 1992 Nov;68(5):1589-602. doi: 10.1152/jn.1992.68.5.1589. J Neurophysiol. 1992. PMID: 1479432
-
A Review of the Neurobiological Mechanisms that Distinguish Between Loudness Recruitment and Hyperacusis.Med Sci Monit. 2022 Apr 9;28:e936373. doi: 10.12659/MSM.936373. Med Sci Monit. 2022. PMID: 35396343 Free PMC article. Review.
-
Advances in the neurobiology of hearing disorders: recent developments regarding the basis of tinnitus and hyperacusis.Prog Neurobiol. 2013 Dec;111:17-33. doi: 10.1016/j.pneurobio.2013.08.002. Epub 2013 Sep 6. Prog Neurobiol. 2013. PMID: 24012803 Review.
Cited by
-
The auditory sensitivity is increased in tinnitus ears.J Neurosci. 2013 Feb 6;33(6):2356-64. doi: 10.1523/JNEUROSCI.3461-12.2013. J Neurosci. 2013. PMID: 23392665 Free PMC article. Clinical Trial.
-
Central gain control in tinnitus and hyperacusis.Front Neurol. 2014 Oct 24;5:206. doi: 10.3389/fneur.2014.00206. eCollection 2014. Front Neurol. 2014. PMID: 25386157 Free PMC article. Review.
-
Insult-induced adaptive plasticity of the auditory system.Front Neurosci. 2014 May 23;8:110. doi: 10.3389/fnins.2014.00110. eCollection 2014. Front Neurosci. 2014. PMID: 24904256 Free PMC article. Review.
-
Hearing in Complex Environments: Auditory Gain Control, Attention, and Hearing Loss.Front Neurosci. 2022 Feb 10;16:799787. doi: 10.3389/fnins.2022.799787. eCollection 2022. Front Neurosci. 2022. PMID: 35221899 Free PMC article. Review.
-
Cochlear Synaptopathy Changes Sound-Evoked Activity Without Changing Spontaneous Discharge in the Mouse Inferior Colliculus.Front Syst Neurosci. 2018 Dec 3;12:59. doi: 10.3389/fnsys.2018.00059. eCollection 2018. Front Syst Neurosci. 2018. PMID: 30559652 Free PMC article.
References
-
- None
- Allen JB. Derecruitment by multiband compression. In: Jesteadt W (ed) Modeling Sensorineural Hearing Loss. London, Erlbaum, 1997.
-
- {'text': '', 'ref_index': 1, 'ids': [{'type': 'PubMed', 'value': '2600627', 'is_inner': True, 'url': 'https://pubmed.ncbi.nlm.nih.gov/2600627/'}]}
- Blackburn CC, Sachs MB. Classification of unit types in the anteroventral cochlear nucleus: PST historgrams and regularity analysis. J. Neurophysiol. 62:1303–1329, 1989. - PubMed
-
- Bourk TR. Electrical Responses of Neural Units in the Anteroventral Cochlear Nucleus of the Cat. Unpublished doctoral thesis. Department of Electrical Engineering and Computer Science, Massachusetts Institute of Technology, Cambridge, MA, 1976.
-
- {'text': '', 'ref_index': 1, 'ids': [{'type': 'DOI', 'value': '10.1007/s101620010084', 'is_inner': False, 'url': 'https://doi.org/10.1007/s101620010084'}, {'type': 'PMC', 'value': 'PMC3202402', 'is_inner': False, 'url': 'https://pmc.ncbi.nlm.nih.gov/articles/PMC3202402/'}, {'type': 'PubMed', 'value': '12162363', 'is_inner': True, 'url': 'https://pubmed.ncbi.nlm.nih.gov/12162363/'}]}
- Buus S, Florentine M. Growth of loudness in listeners with cochlear hearing losses: recruitment reconsidered. J. Assoc. Res. Otolaryngol. 3:120–139, 2002. - PMC - PubMed
-
- Cai S. Intensity encoding of ventral cochlear nucleus neurons in normal and deafened cats and correlates of loudness recruitment. Unpublished Master’s thesis. Department of Biomedical Engineering. The Johns Hopkins University, Baltimore, MD, 2007.
Publication types
MeSH terms
Grants and funding
LinkOut - more resources
Full Text Sources
Miscellaneous
