. 2008 Oct 3;135(1):85-96.
doi: 10.1016/j.cell.2008.08.015.

Mre11 nuclease activity has essential roles in DNA repair and genomic stability distinct from ATM activation

Affiliations

Mre11 nuclease activity has essential roles in DNA repair and genomic stability distinct from ATM activation

Jeffrey Buis et al. Cell. .

Abstract

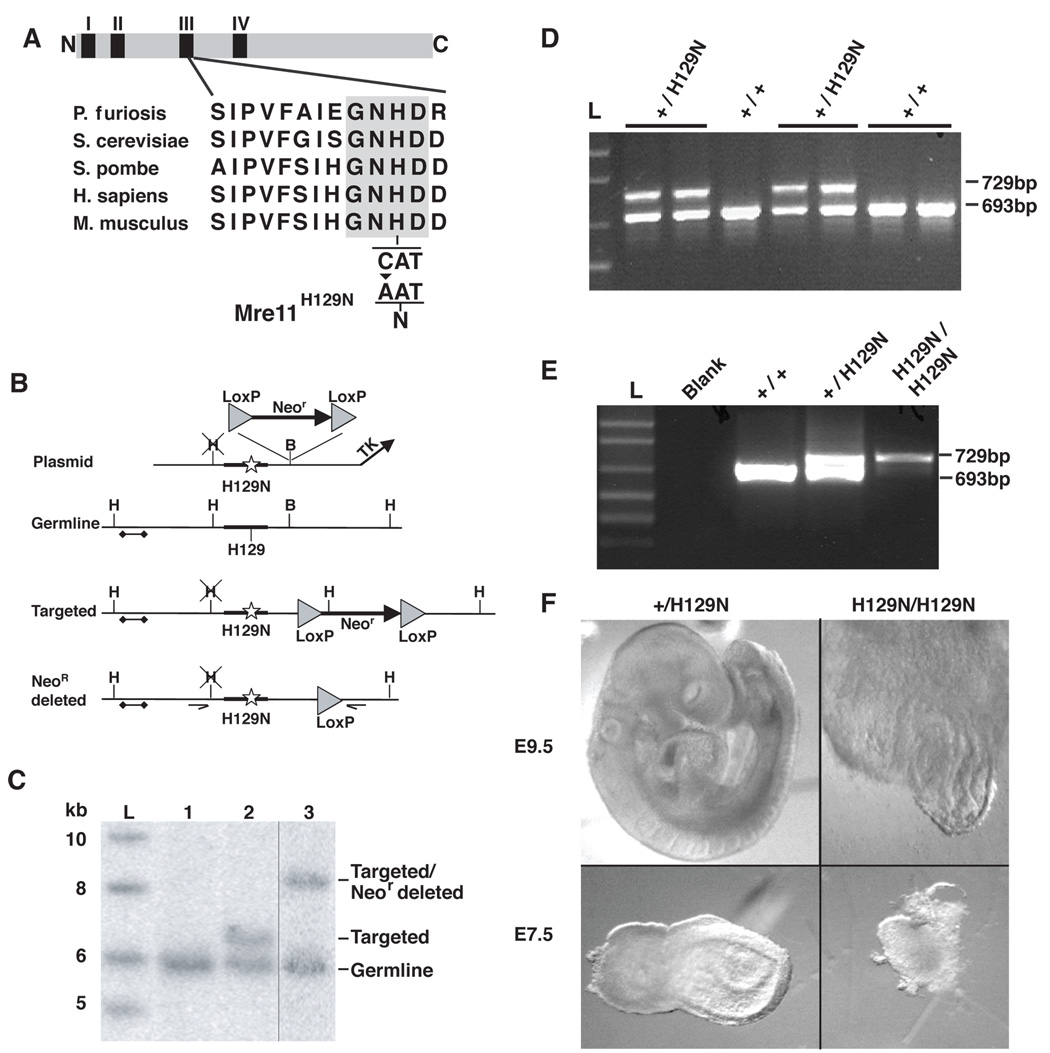
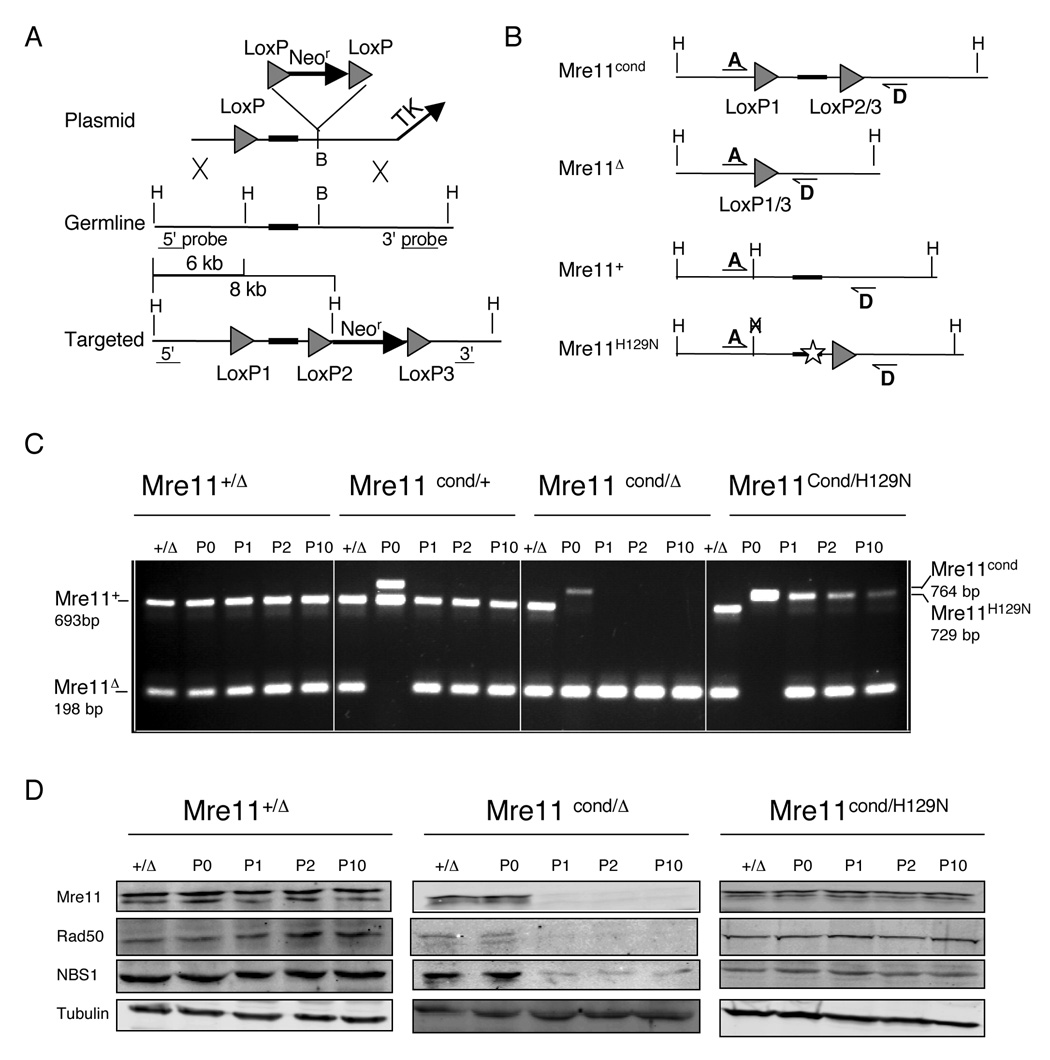
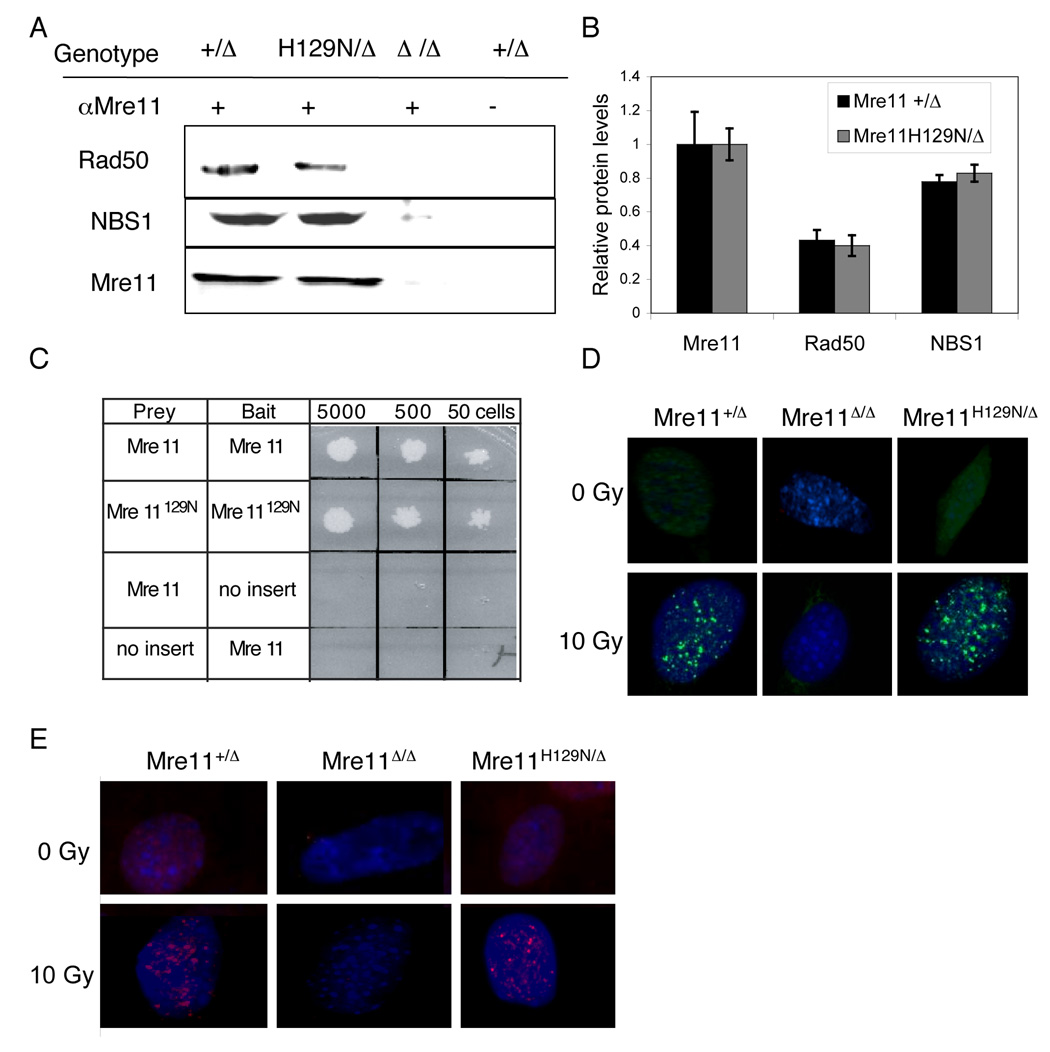
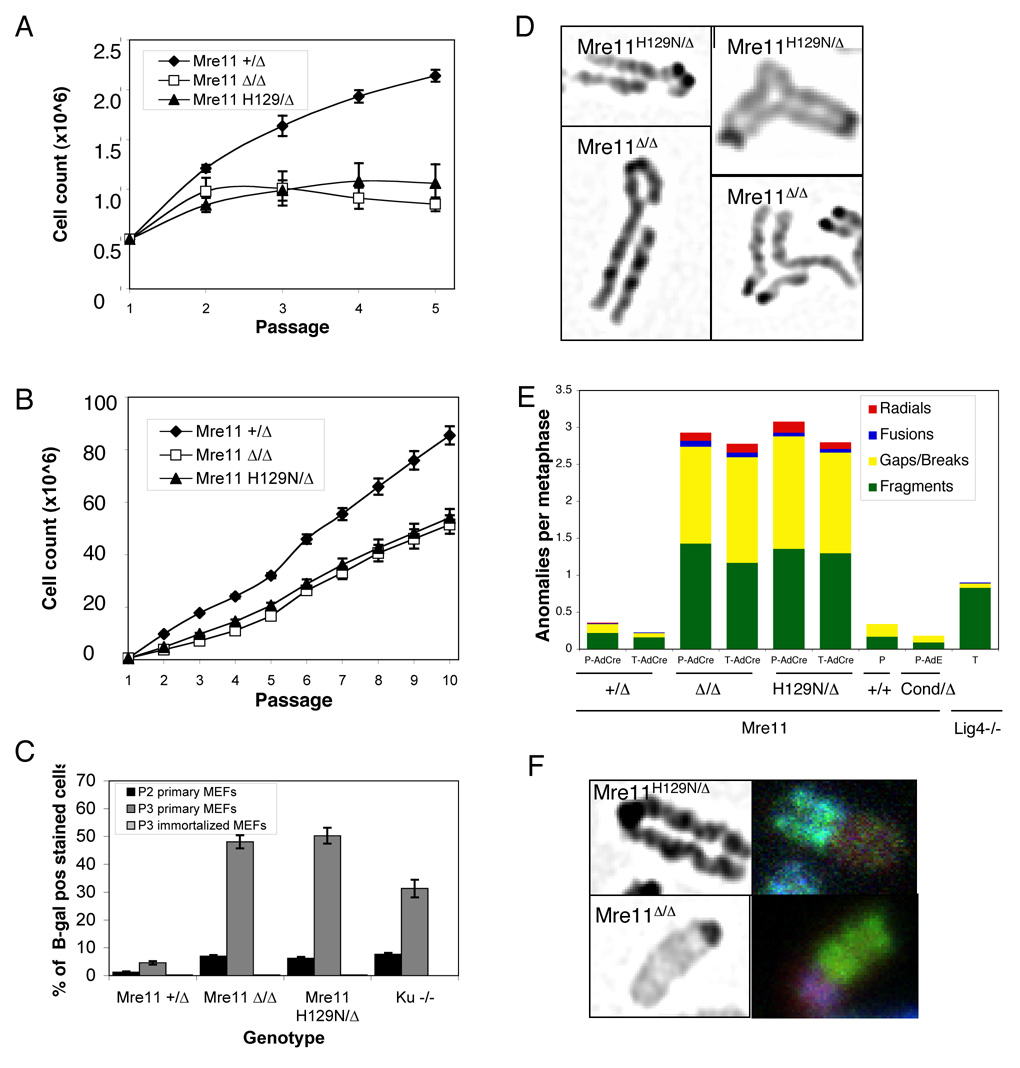
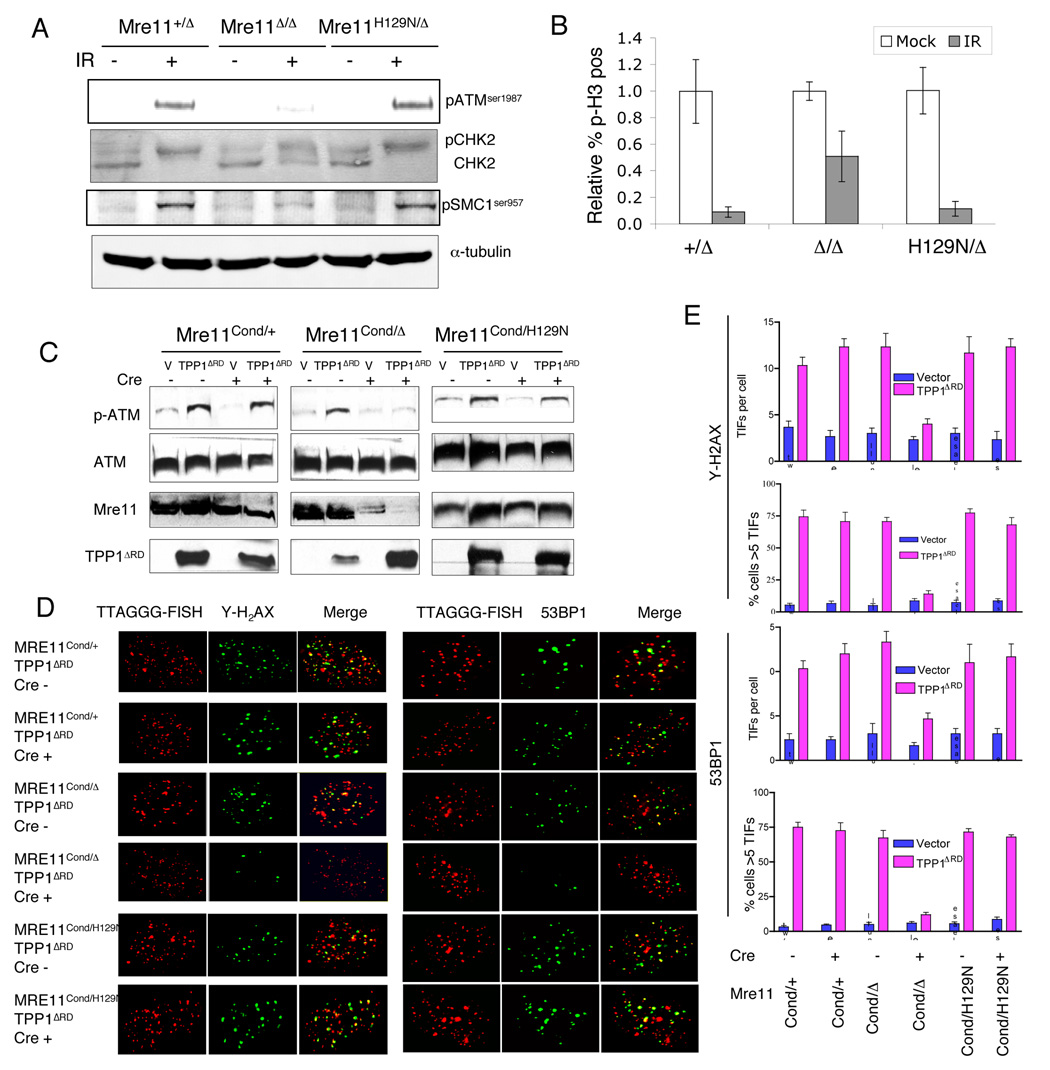
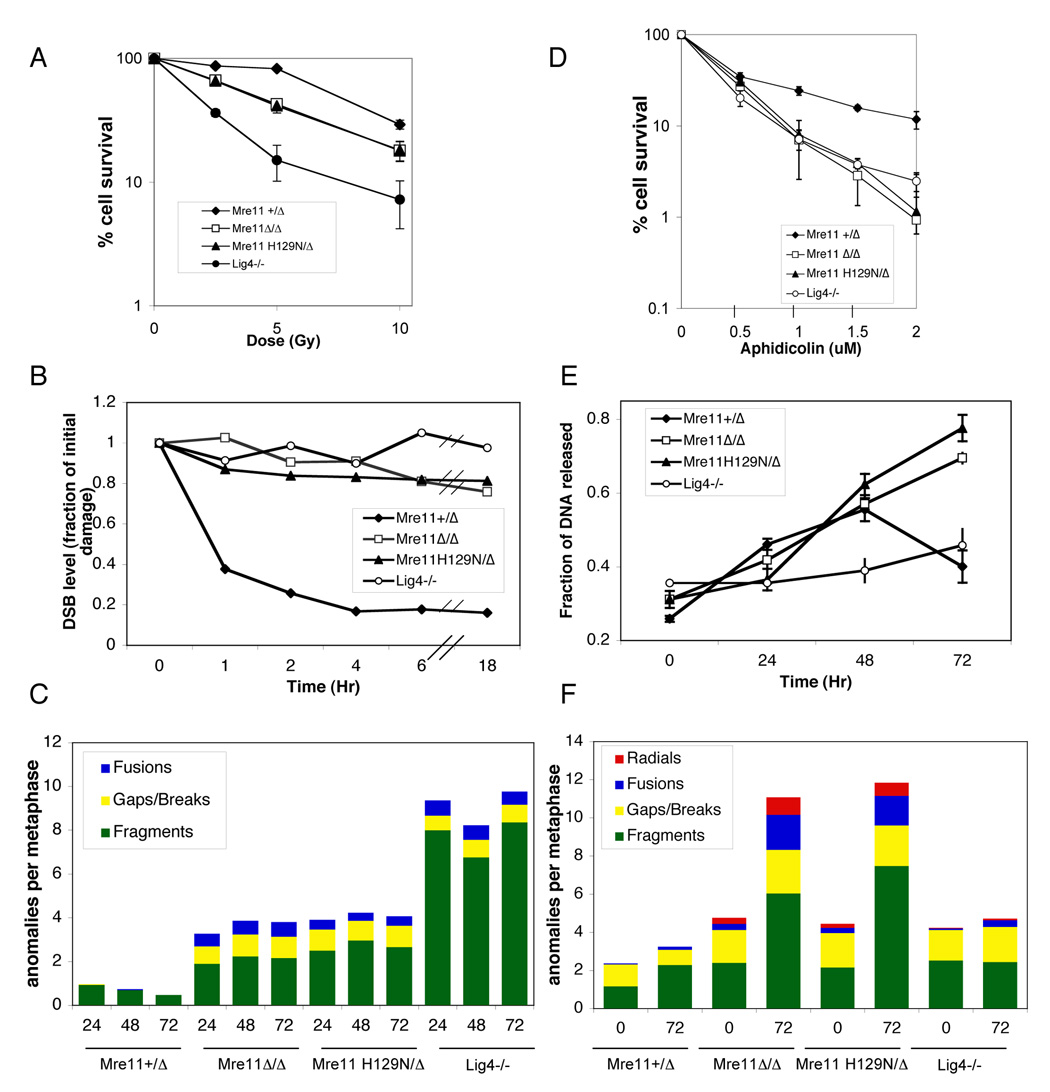
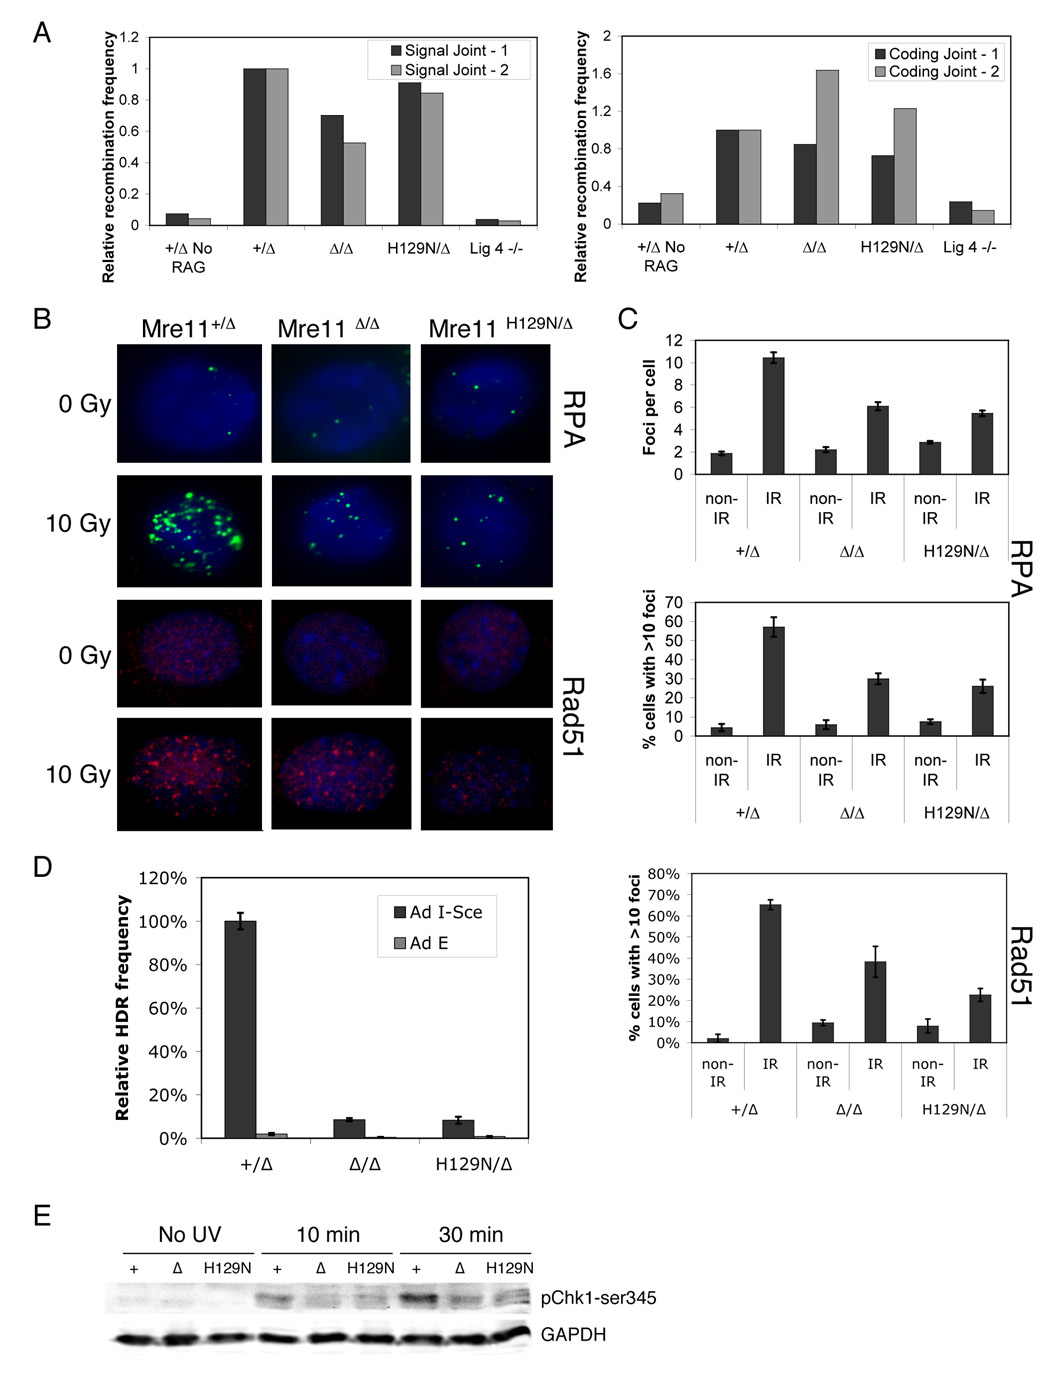
The Mre11/Rad50/NBS1 (MRN) complex maintains genomic stability by bridging DNA ends and initiating DNA damage signaling through activation of the ATM kinase. Mre11 possesses DNA nuclease activities that are highly conserved in evolution but play unknown roles in mammals. To define the functions of Mre11, we engineered targeted mouse alleles that either abrogate nuclease activities or inactivate the entire MRN complex. Mre11 nuclease deficiency causes a striking array of phenotypes indistinguishable from the absence of MRN, including early embryonic lethality and dramatic genomic instability. We identify a crucial role for the nuclease activities in homology-directed double-strand-break repair and a contributing role in activating the ATR kinase. However, the nuclease activities are not required to activate ATM after DNA damage or telomere deprotection. Therefore, nucleolytic processing by Mre11 is an essential function of fundamental importance in DNA repair, distinct from MRN control of ATM signaling.


Figures

Figure 1
Figure 1. Mre11H129N homozygosity causes early embryonic lethality
(A) Alignment of Mre11 nuclease motif III. Invariant residues highlighted. The histidine to asparagine change (H129N) is depicted below the active site histidine. (B) Mre11H129N targeting strategy. Shown are the targeting plasmid with C to A substitution in exon 5 (star in wide line); germline locus; initial targeted configuration; and targeted locus with Neor deleted. Triangles - LoxP sites. Bar with diamonds - Southern blot probe. Arrows - PCR genotyping primers. (C) Southern blot analysis of targeted embryonic stem cell clone. HindIII digested genomic DNA was probed with 5' probe depicted in (B). Lanes as follows; 1-germline, 2-initial targeting, 3-targeted with Neor gene deleted by Cre. L-ladder. (D) Genotyping of germline Mre11H129N/+ mice. PCR genotyping of genomic DNA from mouse tails, using primers depicted in (B). Mre11H129N produces larger band due to remaining LoxP. (E) Genotyping of day e9.5 embryos. Representative Mre11H129N/H129N in right lane. (F) Light microscopic photographs of day e9.5 (top) and e7.5 (bottom) embryos, comparing Mre11+/H129N (left) to Mre11H129N/H129N (right).
Figure 2
Figure 2. Mre11 conditional allele allows bypass of Mre11H129N embryonic lethality
(A) Targeting strategy to generate wildtype conditional Mre11 allele. The targeting plasmid was similar to the H129N plasmid depicted in Figure 1, except a LoxP site (triangle) was inserted in the HindIII (H) site upstream of exon 5, which maintained wildtype sequence. (B) Configurations of four unique Mre11 alleles; Mre11 conditional (Mre11cond), Mre11 null (Mre11), wildtype (Mre11+), nuclease deficient (Mre11H129N). Lines with half arrowheads (A and D) depict PCR primers used to distinguish the four alleles. (C) PCR analyses of genomic DNA from immortalized MEFs before (passage 0 = P0) and after (passages 1, 2 and 10 = P1, P2, P10) introduction of Cre recombinase. Genotypes indicated were those prior to Cre mediated conversion of Mre11cond to Mre11Δ. Primers are depicted in (B). +/Δ; tail DNA sample used for size comparison of bands. (D) Western blot analyses of MRN components. Extracts were prepared from the passages shown at top of each panel, and match those in (C). Genotypes indicated were those prior to Cre mediated conversion of Mre11cond to Mre11Δ. Antibodies indicated at left. Tubulin is protein loading control.
Figure 3
Figure 3. Stability of the MH129N RN complex
(A) The Mre11+ and Mre11H129N proteins associate with equal quantities of endogenous NBS1 and Rad50. IPs using antibody to Mre11 were performed on MEF extracts. Western blots were performed with antibodies to the MRN components (left). (B) Quantitation of co-IPs with protein levels expressed relative to Mre11. Error bars represent ± SEM from three independent experiments. (C) Mre11H129N protein can homodimerize. Yeast two hybrid analyses using the indicated mouse cDNAs as prey or bait. Numbers at top indicate number of cells plated. White coloration represents growth of yeast in selective media, reflecting interaction. (D) Mre11 (green) and (E) NBS1 (red) immunofluorescent foci in MEFs exposed to 10 Gy IR.
Figure 4
Figure 4. Cellular phenotypes of Mre11H129N phenocopy MRN deficiency
(A – F) Genotypes indicated are after Cre mediated conversion of Mre11cond to Mre11Δ. (A and B) Primary (A) or immortalized (B) MEFs were passaged and counted every 3 days. Symbols and error bars represent averages ± SEM from three independent experiments, using two independent cell lines for each genotype. Cell numbers plotted as a function of passage number. (C) Primary and immortalized MEFs were assessed for cellular senescence using SA-β-Gal staining at passages 2 and 3 (P2 and P3) in primary MEFs and P3 in immortalized MEFs. Bars for P3 immortalized MEFs are depicted, but very short. Immortalized Ku−/− not presented. Error bars represent ± SEM from three independent experiments. (D) Spontaneous genomic instability in Mre11H129N/Δ versus Mre11Δ/Δ MEFs. Metaphase spreads were stained with DAPI. Examples of single chromatid gaps (left) and radial chromosomes (right) are shown. (E) Spectrum of chromosome anomalies in Mre11Δ/Δ and Mre11H129N/Δ MEFs. Primary (P) or T antigen immortalized (T) cells were exposed to adenovirus expressing Cre recombinase (AdCre), no virus, or a control adenovirus (AdE) without Cre. Lig4−/− MEFs were used for comparison. Metaphase spreads were stained with DAPI. Y-axis indicates anomalies per metaphase. Colors indicate proportions of different anomalies. (F) Representative chromosome translocations in Mre11Δ/Δ and Mre11H129N/Δ metaphases. DAPI staining (left) and SKY paint mixture (right).
Figure 5
Figure 5. Mre11 nuclease activities are not required for ATM activation
(A–B) Genotypes indicated reflect those after Cre mediated conversion of MreCond to Mre11Δ. (A) Immunoblotting for ATM substrates (right) was performed on whole cell lysates with the indicated antibodies 1 hour after 10 Gy IR. Tubulin - loading control. Each blot is a representative example of at least 3 independent experiments. (B) Assessment of the G2/M checkpoint. MEFs were harvested 1 hour after 10 Gy IR. Mock - no IR. Cells committed to M phase were identified by positive staining (flow cytometry) for phosphorylated histone H3 (p-H3) (Y axis). The mitotic index obtained from the mock sample from each genotype was set to 1.0 and after irradiation is expressed as a percentage of mock. Error bars indicate ± SEM from three independent experiments. (C–E) Mre11 genotypes shown are those prior to Cre mediated conversion of Mre11Cond to Mre11Δ. (C) ATM1987 autophosphorylation induced by telomere deprotection caused by HA-TPP1ΔRD expression. TPP1ΔRD was detected by anti-HA antibody. Total ATM served as loading control. (D) γ-H2AX (left panel) and 53BP1 (right panel) foci at telomeres (TIFs) induced by expression of TPP1ΔRD. MEFs expressing TPP1ΔRD were infected either with AdE or AdCre and analyzed by telomere (TTAGGG) PNA-FISH (red) and antibody (green) to γ-H2AX or 53BP1. (E) Quantitation of TIFs from experiments described in (D). The number of TIFs per cell, as well as the percentage of cells containing five or more γ-H2AX or 53BP1 TIFs are shown. Error bars represent ±SEM.
Figure 6
Figure 6. DSB repair defects in Mre11 nuclease and MRN deficiencies
(A) Comparison of ionizing radiation sensitivities. The Y axis indicates percent of cells relative to unirradiated control populations, and the X axis indicates increasing doses of IR. Error bars represent ±SEM of 3 independent experiments. (B) Quantitation of DNA damage levels after IR. MEFs of the indicated genotypes were exposed to 80 Gy IR and allowed to recover for various times (X axis). The DSB level (Y axis) based on quantitation of CHEF gels was calculated as a ratio of the amount of damage at each recovery time to that at time 0. Shown is representative of at least three experiments for each line. (C) Radiation induced chromosome instability persists in Mre11 nuclease and MRN deficiencies. MEFs were exposed to 2 Gy IR, followed by recovery times of 24, 48 and 72 hours (X axis). Metaphases were stained with DAPI. Y-axis - anomalies per metaphase. (D) Comparison of sensitivities to the DNA polymerase inhibitor aphidicolin. Y axis indicates percent of cells relative to untreated control populations, and X axis indicates increasing doses of aphidicolin. Error bars represent ±SEM of 3 independent experiments. (E) Quantitation of DNA damage levels after aphidicolin exposure. MEFs of the indicated genotypes were exposed to aphidicolin for 24 hours and allowed to recover for various times (X axis, 0 represents 24 hour exposure with no recovery). The fraction of DNA released (Y axis) at each recovery time was calculated from the ratio of DNA entering the gel (damaged) to total. Error bars represent ±SEM. (F) Aphidicolin induced chromosome instability persists in Mre11 nuclease and MRN deficiencies. MEFs were exposed to 0.4µM aphidicolin for 24 hours followed by 0 or 72 hours recovery. Metaphase spreads were stained with DAPI. Y-axis indicates anomalies per metaphase.
Figure 7
Figure 7. Mre11 nuclease activities in resection and recombination
(A) Transient transfection based V(D)J recombination assay. (Left) Signal joining (blunt ends). (Right) coding joins (hairpin ends). Two representative experiments shown for each. For relative recombination frequency (Y axis), results from control (Mre11Δ/+) were set to 1.0. (B) IR induced RPA1 (top) and Rad51 (bottom) foci. (C) Quantitation of foci described in (B). Error bars represent ±SEM of 3 independent experiments. (D) Relative frequencies of HDR using DR-GFP substrate. HDR events were scored as the percentage of GFP-positive populations after I-SceI expression. The percentage of GFP-positive cells in Mre11+/Δ was set to 100%. Error bars represent ±SEM from three independent DR-GFP clones of each genotype. (E) Immunoblotting for phospho-Chk1ser345. Cells exposed to 5 J/m2 UV recovered for the indicated times. GAPDH - loading control. Blot is representative of 3 experiments.

Comment in

Similar articles

Cited by

References

    1. Arthur LM, Gustausson K, Hopfner KP, Carson CT, Stracker TH, Karcher A, Felton D, Weitzman MD, Tainer J, Carney JP. Structural and functional analysis of Mre11-3. Nucleic Acids Res. 2004;32:1886–1893. - PMC - PubMed
    1. Bakkenist CJ, Kastan MB. DNA damage activates ATM through intermolecular autophosphorylation and dimer dissociation. Nature. 2003;421:499–506. - PubMed
    1. Bender CF, Sikes ML, Sullivan R, Huye LE, Le Beau MM, Roth DB, Mirzoeva OK, Oltz EM, Petrini JH. Cancer predisposition and hematopoietic failure in Rad50(S/S) mice. Genes Dev. 2002;16:2237–2251. - PMC - PubMed
    1. Berkovich E, Monnat RJ, Jr, Kastan MB. Roles of ATM and NBS1 in chromatin structure modulation and DNA double-strand break repair. Nat Cell Biol. 2007;9:683–690. - PubMed
    1. Boisvert FM, Dery U, Masson JY, Richard S. Arginine methylation of MRE11 by PRMT1 is required for DNA damage checkpoint control. Genes Dev. 2005;19:671–676. - PMC - PubMed

Publication types

MeSH terms