Fibroblast growth factor receptor-mediated signals contribute to the malignant phenotype of non-small cell lung cancer cells: therapeutic implications and synergism with epidermal growth factor receptor inhibition
- PMID: 18852144
- PMCID: PMC2879863
- DOI: 10.1158/1535-7163.MCT-08-0444
Fibroblast growth factor receptor-mediated signals contribute to the malignant phenotype of non-small cell lung cancer cells: therapeutic implications and synergism with epidermal growth factor receptor inhibition
Abstract
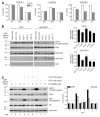
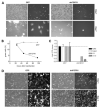
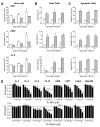
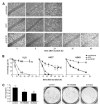
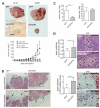
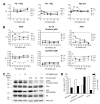
Fibroblast growth factors (FGF) and their high-affinity receptors (FGFR) represent an extensive cellular growth and survival system. Aim of this study was to evaluate the contribution of FGF/FGFR-mediated signals to the malignant growth of non-small cell lung cancer (NSCLC) and to assess their potential as targets for therapeutic interventions. Multiple FGFR mRNA splice variants were coexpressed in NSCLC cells (n = 16) with predominance of FGFR1. Accordingly, both expression of a dominant-negative FGFR1 (dnFGFR1) IIIc-green fluorescent protein fusion protein and application of FGFR small-molecule inhibitors (SU5402 and PD166866) significantly reduced growth, survival, clonogenicity, and migratory potential of the majority of NSCLC cell lines. Moreover, dnFGFR1 expression completely blocked or at least significantly attenuated s.c. tumor formation of NSCLC cells in severe combined immunodeficient mice. Xenograft tumors expressing dnFGFR1 exhibited significantly reduced size and mitosis rate, enhanced cell death, and decreased tissue invasion. When FGFR inhibitors were combined with chemotherapy, antagonistic to synergistic in vitro anticancer activities were obtained depending on the application schedule. In contrast, simultaneous blockage of FGFR- and epidermal growth factor receptor-mediated signals exerted synergistic effects. In summary, FGFR-mediated signals in cooperation with those transmitted by epidermal growth factor receptor are involved in growth and survival of human NSCLC cells and should be considered as targets for combined therapeutic approaches.
Figures
Similar articles
-
Interaction between the estrogen receptor and fibroblast growth factor receptor pathways in non-small cell lung cancer.Oncotarget. 2017 Apr 11;8(15):24063-24076. doi: 10.18632/oncotarget.16030. Oncotarget. 2017. PMID: 28445992 Free PMC article.
-
Gambogenic acid inhibits fibroblast growth factor receptor signaling pathway in erlotinib-resistant non-small-cell lung cancer and suppresses patient-derived xenograft growth.Cell Death Dis. 2018 Feb 15;9(3):262. doi: 10.1038/s41419-018-0314-6. Cell Death Dis. 2018. PMID: 29449529 Free PMC article.
-
Co-active receptor tyrosine kinases mitigate the effect of FGFR inhibitors in FGFR1-amplified lung cancers with low FGFR1 protein expression.Oncogene. 2016 Jul 7;35(27):3587-97. doi: 10.1038/onc.2015.426. Epub 2015 Nov 9. Oncogene. 2016. PMID: 26549034
-
Fibroblast Growth Factor Receptor (FGFR): A New Target for Non-small Cell Lung Cancer Therapy.Anticancer Agents Med Chem. 2016;16(9):1142-54. doi: 10.2174/1871520616666160204112347. Anticancer Agents Med Chem. 2016. PMID: 26845137 Review.
-
Selective FGFR/FGF pathway inhibitors: inhibition strategies, clinical activities, resistance mutations, and future directions.Expert Rev Clin Pharmacol. 2021 Oct;14(10):1233-1252. doi: 10.1080/17512433.2021.1947246. Expert Rev Clin Pharmacol. 2021. PMID: 34591728 Review.
Cited by
-
Acquired nintedanib resistance in FGFR1-driven small cell lung cancer: role of endothelin-A receptor-activated ABCB1 expression.Oncotarget. 2016 Aug 2;7(31):50161-50179. doi: 10.18632/oncotarget.10324. Oncotarget. 2016. PMID: 27367030 Free PMC article.
-
Rapidly acquired resistance to EGFR tyrosine kinase inhibitors in NSCLC cell lines through de-repression of FGFR2 and FGFR3 expression.PLoS One. 2010 Nov 29;5(11):e14117. doi: 10.1371/journal.pone.0014117. PLoS One. 2010. PMID: 21152424 Free PMC article.
-
Dramatic response to inhaled dobesilate in a patient with lung squamous cell cancer.BMJ Case Rep. 2012 Sep 5;2012:bcr2012006622. doi: 10.1136/bcr-2012-006622. BMJ Case Rep. 2012. PMID: 22952275 Free PMC article.
-
Fibroblast Growth Factor Receptor 1-4 Genetic Aberrations as Clinically Relevant Biomarkers in Squamous Cell Lung Cancer.Front Oncol. 2022 Mar 25;12:780650. doi: 10.3389/fonc.2022.780650. eCollection 2022. Front Oncol. 2022. PMID: 35402233 Free PMC article. Review.
-
EGFR is not a major driver for osteosarcoma cell growth in vitro but contributes to starvation and chemotherapy resistance.J Exp Clin Cancer Res. 2015 Nov 2;34:134. doi: 10.1186/s13046-015-0251-5. J Exp Clin Cancer Res. 2015. PMID: 26526352 Free PMC article.
References
-
- Herbst RS, Dang NH, Skarin AT. Chemotherapy for advanced non-small cell lung cancer. Hematol Oncol Clin North Am. 1997;11:473–517. - PubMed
-
- Smith PW, Denlinger CE, Jones DR. Novel targeted therapies for non-small cell lung cancer. Thorac Surg Clin. 2006;16:353–66. - PubMed
-
- Byers LA, Heymach JV. Dual targeting of the vascular endothelial growth factor and epidermalgrowth factor receptor pathways: rationale and clinical applications for non-small-cell lung cancer. Clin Lung Cancer. 2007;8(Suppl2):S79–85. - PubMed
-
- Jeffers M, LaRochelle WJ, Lichenstein HS. Fibroblast growth factors in cancer: therapeutic possibilities. Expert Opin Ther Targets. 2002;6:469–82. - PubMed
-
- Powers CJ, McLeskey SW, Wellstein A. Fibroblast growth factors, their receptors and signaling. Endocr Relat Cancer. 2000;7:165–97. - PubMed
Publication types
MeSH terms
Substances
Grants and funding
LinkOut - more resources
Full Text Sources
Other Literature Sources
Medical
Research Materials
Miscellaneous

