Removal of AU bias from microarray mRNA expression data enhances computational identification of active microRNAs
- PMID: 18833292
- PMCID: PMC2533120
- DOI: 10.1371/journal.pcbi.1000189
Removal of AU bias from microarray mRNA expression data enhances computational identification of active microRNAs
Abstract
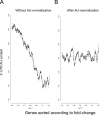
Elucidation of regulatory roles played by microRNAs (miRs) in various biological networks is one of the greatest challenges of present molecular and computational biology. The integrated analysis of gene expression data and 3'-UTR sequences holds great promise for being an effective means to systematically delineate active miRs in different biological processes. Applying such an integrated analysis, we uncovered a striking relationship between 3'-UTR AU content and gene response in numerous microarray datasets. We show that this relationship is secondary to a general bias that links gene response and probe AU content and reflects the fact that in the majority of current arrays probes are selected from target transcript 3'-UTRs. Therefore, removal of this bias, which is in order in any analysis of microarray datasets, is of crucial importance when integrating expression data and 3'-UTR sequences to identify regulatory elements embedded in this region. We developed visualization and normalization schemes for the detection and removal of such AU biases and demonstrate that their application to microarray data significantly enhances the computational identification of active miRs. Our results substantiate that, after removal of AU biases, mRNA expression profiles contain ample information which allows in silico detection of miRs that are active in physiological conditions.
Conflict of interest statement
The authors have declared that no competing interests exist.
Figures


Similar articles
-
Characterization of B- and T-lineage acute lymphoblastic leukemia by integrated analysis of MicroRNA and mRNA expression profiles.Genes Chromosomes Cancer. 2009 Dec;48(12):1069-82. doi: 10.1002/gcc.20709. Genes Chromosomes Cancer. 2009. PMID: 19760605
-
Genome-wide identification of small RNA targets based on target enrichment and microarray hybridizations.Plant J. 2009 Sep;59(5):840-50. doi: 10.1111/j.1365-313X.2009.03904.x. Epub 2009 May 2. Plant J. 2009. PMID: 19453461
-
Integrative molecular bioinformatics study of human adrenocortical tumors: microRNA, tissue-specific target prediction, and pathway analysis.Endocr Relat Cancer. 2009 Sep;16(3):895-906. doi: 10.1677/ERC-09-0096. Epub 2009 Jun 22. Endocr Relat Cancer. 2009. PMID: 19546168
-
MicroRNA profiling of megakaryocytes.Methods Mol Biol. 2009;496:293-8. doi: 10.1007/978-1-59745-553-4_19. Methods Mol Biol. 2009. PMID: 18839118 Review.
-
MicroRNAs in normal and malignant myelopoiesis.Leuk Res. 2009 Dec;33(12):1584-93. doi: 10.1016/j.leukres.2009.04.039. Epub 2009 May 30. Leuk Res. 2009. PMID: 19482355 Review.
Cited by
-
Experimental design, preprocessing, normalization and differential expression analysis of small RNA sequencing experiments.Silence. 2011 Feb 28;2(1):2. doi: 10.1186/1758-907X-2-2. Silence. 2011. PMID: 21356093 Free PMC article.
-
MixMir: microRNA motif discovery from gene expression data using mixed linear models.Nucleic Acids Res. 2014;42(17):e135. doi: 10.1093/nar/gku672. Epub 2014 Jul 31. Nucleic Acids Res. 2014. PMID: 25081207 Free PMC article.
-
Relative contribution of sequence and structure features to the mRNA binding of Argonaute/EIF2C-miRNA complexes and the degradation of miRNA targets.Genome Res. 2009 Nov;19(11):2009-20. doi: 10.1101/gr.091181.109. Epub 2009 Sep 18. Genome Res. 2009. PMID: 19767416 Free PMC article.
-
The DIANA-mirExTra web server: from gene expression data to microRNA function.PLoS One. 2010 Feb 11;5(2):e9171. doi: 10.1371/journal.pone.0009171. PLoS One. 2010. PMID: 20161787 Free PMC article.
-
Signatures of RNA binding proteins globally coupled to effective microRNA target sites.Genome Res. 2010 Aug;20(8):1010-9. doi: 10.1101/gr.103259.109. Epub 2010 May 27. Genome Res. 2010. PMID: 20508147 Free PMC article.
References
-
- Kim VN, Nam JW. Genomics of microRNA. Trends Genet. 2006;22:165–173. - PubMed
-
- Lewis BP, Burge CB, Bartel DP. Conserved seed pairing, often flanked by adenosines, indicates that thousands of human genes are microRNA targets. Cell. 2005;120:15–20. - PubMed
-
- Rajewsky N. MicroRNA target predictions in animals. Nat Genet. 2006;38:S8–S13. - PubMed
Publication types
MeSH terms
Substances
LinkOut - more resources
Full Text Sources
Other Literature Sources

