Multicenter Study
. 2008 Oct 15;181(8):5490-500.
doi: 10.4049/jimmunol.181.8.5490.

T cell responses to whole SARS coronavirus in humans

Affiliations
Multicenter Study

T cell responses to whole SARS coronavirus in humans

Chris Ka-fai Li et al. J Immunol. .

Abstract

Effective vaccines should confer long-term protection against future outbreaks of severe acute respiratory syndrome (SARS) caused by a novel zoonotic coronavirus (SARS-CoV) with unknown animal reservoirs. We conducted a cohort study examining multiple parameters of immune responses to SARS-CoV infection, aiming to identify the immune correlates of protection. We used a matrix of overlapping peptides spanning whole SARS-CoV proteome to determine T cell responses from 128 SARS convalescent samples by ex vivo IFN-gamma ELISPOT assays. Approximately 50% of convalescent SARS patients were positive for T cell responses, and 90% possessed strongly neutralizing Abs. Fifty-five novel T cell epitopes were identified, with spike protein dominating total T cell responses. CD8(+) T cell responses were more frequent and of a greater magnitude than CD4(+) T cell responses (p < 0.001). Polychromatic cytometry analysis indicated that the virus-specific T cells from the severe group tended to be a central memory phenotype (CD27(+)/CD45RO(+)) with a significantly higher frequency of polyfunctional CD4(+) T cells producing IFN-gamma, TNF-alpha, and IL-2, and CD8(+) T cells producing IFN-gamma, TNF-alpha, and CD107a (degranulation), as compared with the mild-moderate group. Strong T cell responses correlated significantly (p < 0.05) with higher neutralizing Ab. The serum cytokine profile during acute infection indicated a significant elevation of innate immune responses. Increased Th2 cytokines were observed in patients with fatal infection. Our study provides a roadmap for the immunogenicity of SARS-CoV and types of immune responses that may be responsible for the virus clearance, and should serve as a benchmark for SARS-CoV vaccine design and evaluation.


Conflict of interest statement

Disclosures

The authors have no financial conflict of interest.

Figures
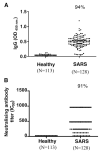
FIGURE 1
FIGURE 1
SARS-CoV-specific Ab responses in patients recovered from SARS-CoV infection. A, Response of SARS specific-IgG between high-risk healthy group and SARS pneumonia by ELISA. The assay was based on purified whole virus lysates, and positive was defined by an OD value >0.14. B, Response of neutralizing Ab against spike protein of SARS-CoV using pseudotype-based virus neutralization test. In this assay, heat-inactivated serum samples were mixed with murine leukemia virus (MLV) pseudotyped with SARS spike protein MLV (SARS) virions before infecting QT6 cells expressing ACE2, a receptor for SARS-CoV virus for 48 h. The pseudotype virus had a GFP-reporter, and infected cells turned green and were counted by fluorescence microscopy. IC90 was used as end-point titer, and titers ≥1:10 were considered to be positive.
FIGURE 2
FIGURE 2
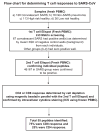
Flow chart for determining T cell responses to SARS-CoV. Freshly isolated PBMC were stimulated with SARS-specific peptides spanning across the entire SARS-CoV proteome (1,843 overlapping peptides), and the immediate IFN-γ release by T cell responses were measured by IFN-γ ELISPOT assay as described in the Materials and Methods. The 2-dimensional matrices were set up with a total of 88 pools (1-dimensional = 43 pools; 2-dimensional = 44 pools; up to 45 peptides/pool) so that each peptide was present in two different pools. Peptides were used at a final concentration of 2 μM each.
FIGURE 3
FIGURE 3
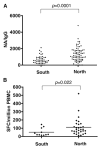
SARS-specific Ab and T cell responses from convalescent SARS patients between South and North cohorts. A, Serum samples were tested for SARS-specific IgG and neutralizing Ab, and the corrected neutralizing Ab response over the total SARS-specific IgG is shown on the y-axis. B, Freshly isolated PBMC were stimulated with peptides from SARS proteome, and the IFN-γ response was measured by ELISPOT assay.
FIGURE 4
FIGURE 4
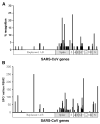
Distribution of peptide recognition and magnitude of SARS-specific T cell responses across the entire expressed SARS-CoV genome in convalescent SARS patients, as determined by immediate IFN-γ ELISPOT assay. Freshly isolated PBMC from convalescent SARS samples were stimulated overnight with overlapping peptides of different proteins across SARS genome, and the IFN-γ response was measured by ELISPOT assay. The individual 1,843 overlapping peptides of different proteins are represented on the x-axis. A, The y-axis represents the percentage recognition of the study subjects to the individual peptide. B, The y-axis represents the average magnitude of response by the study subjects to individual peptides.
FIGURE 5
FIGURE 5
Breadth and magnitude of SARS-specific T cell responses between CD8+ and CD4+ responses in convalescent SARS samples by IFN-γ ELISPOT assays. A, Number of epitopes recognized by each study subject, as represented on the y-axis, is compared between CD8+ and CD4+ responses. B, Magnitude of response as measured by SFC per million PBMC, as represented by the y-axis, is compared between CD8+ and CD4+ responses. C, Breadth of CD8+ response as measured by the percent recognition of the peptide response across the SARS-CoV proteome. D, Magnitude of CD8+ response as measured by the SFC per million PBMC. E, Breadth of CD4+ response as measured by the percent recognition of the peptide response across the SARS-CoV proteome. F, Magnitude of CD4+ response as measured by the SFC per million PBMC. p values represent the results of a Mann-Whitney U test.
FIGURE 6
FIGURE 6
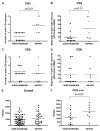
T cell and Ab responses between mild-to-moderate and severe groups of convalescent SARS patients. A, Number of CD4+ spike responses, as represented on the y-axis, is compared between mild-to-moderate and severe groups, as measured by IFN-γ ELISPOT assay. B, Magnitude of CD4+ spike response as represented by SFC per million PBMC is compared between mild-to-moderate and severe groups. C, Number of CD8+ spike responses as represented on the y-axis is compared between mild-moderate and severe groups. D, Magnitude of CD8+ spike response as represented by SFC per million PBMC between mild-to-moderate and severe groups. E, The corrected neutralizing Ab response in all SARS samples studied, as represented on the y-axis, from all samples between mild-to-moderate and severe groups, as measured by SARS IgG and neutralizing Ab. F, The corrected neutralizing Ab response as represented on the y-axis from SARS patients (mild-to-moderate or severe groups) who have spike-specific CD4+ T cell responses. p values represent the results of a Mann-Whitney U test.
FIGURE 7
FIGURE 7
Phenotype, functionality, and frequency of SARS-specific CD4+ T cells in blood. Lymphocytes were stimulated with overlapping SARS peptides and stained as described in the Materials and Methods. A, The memory phenotype of SARS-specific CD4+ T cells in individuals with mild-to-moderate and in individuals with severe SARS, as defined by the expression of CD27 and CD45RO. B, Functionality of SARS-specific CD4+ T cells in individuals with moderate and in individuals with severe SARS. C, Frequency of SARS-specific CD4+ T cells. The response is shown as the percentage of memory CD4+ T cells that are SARS-specific. The frequency of the total SARS-specific responses producing one, two, three, four, or five functions was determined using SPICE as described in methods. p values represent the results of a Mann-Whitney U test.
FIGURE 8
FIGURE 8
Phenotype, functionality, and frequency of SARS-specific CD8+ T cells in blood. Lymphocytes were stimulated with overlapping SARS peptides and stained as described in the Materials and Methods. A, The memory phenotype of SARS-specific CD8+ T cells in individuals with mild-to-moderate and in individuals with severe SARS, as defined by the expression of CD27 and CD45RO. B, Functionality of SARS-specific CD8+ T cells in individuals with moderate and in individuals with severe SARS. C, Frequency of SARS-specific CD8+ T cells. The response is shown as the percentage of memory CD8+ T cells that are SARS-specific. The frequency of the total SARS-specific responses producing one, two, three, four, or five functions was determined using SPICE as described in methods. p values represent the results of a Mann-Whitney U test.
FIGURE 9
FIGURE 9
Serum cytokine profile between acute SARS and non-SARS pneumonia by cytometric beads arrays. Serum samples (>90%) were collected within 2 days of hospital admission before any specific drug treatment, and none of the patients received steroid therapy before sample collection. The average time of sera collection following disease onset was 7.5 days ± 4.4 SD. p values represent the results of a Mann-Whitney U test.

Similar articles

Cited by

References

    1. Zhao GP. SARS molecular epidemiology: a Chinese fairy tale of controlling an emerging zoonotic disease in the genomics era. Philos Trans R Soc Lond B. 2007;362:1063–1081. - PMC - PubMed
    1. Shi Z, Hu Z. A review of studies on animal reservoirs of the SARS coronavirus. Virus Res. 2007;133:74–87. - PMC - PubMed
    1. Li W, Shi Z, Yu M, Ren W, Smith C, Epstein JH, Wang H, Crameri G, Hu Z, Zhang H, et al. Bats are natural reservoirs of SARS-like corona-viruses. Science. 2005;310:676–679. - PubMed
    1. Stockman LJ, Bellamy R, Garner P. SARS: systematic review of treatment effects. PLoS Med. 2006;3:e343. - PMC - PubMed
    1. Chu CM, Poon LL, Cheng VC, Chan KS, Hung IF, Wong MM, Chan KH, Leung WS, Tang BS, Chan VL, et al. Initial viral load and the outcomes of SARS. Canadian Medical Association Journal. 2004;171:1349–1352. - PMC - PubMed

Publication types

MeSH terms