. 2008 Dec;82(24):12291-303.
doi: 10.1128/JVI.01383-08. Epub 2008 Oct 1.

Epigenetic silencing of human immunodeficiency virus (HIV) transcription by formation of restrictive chromatin structures at the viral long terminal repeat drives the progressive entry of HIV into latency

Affiliations

Epigenetic silencing of human immunodeficiency virus (HIV) transcription by formation of restrictive chromatin structures at the viral long terminal repeat drives the progressive entry of HIV into latency

Richard Pearson et al. J Virol. 2008 Dec.

Abstract

The molecular mechanisms utilized by human immunodeficiency virus (HIV) to enter latency are poorly understood. Following the infection of Jurkat T cells with lentiviral vectors that express Tat in cis, gene expression is progressively silenced. Silencing is greatly enhanced when the lentiviral vectors carry an attenuated Tat gene with the H13L mutation. Individual clones of lentivirus-infected cells showed a wide range of shutdown rates, with the majority showing a 50% silencing frequency between 30 to 80 days. The silenced clones characteristically contained a small fraction (0 to 15%) of activated cells that continued to express d2EGFP. When d2EGFP(+) and d2EGFP(-) cell populations were isolated from the shutdown clones, they quickly reverted to the original distribution of inactive and active cells, suggesting that the d2EGFP(+) cells arise from stochastic fluctuations in gene expression. The detailed analysis of transcription initiation and elongation using chromatin immunoprecipitation (ChIP) assays confirms that Tat levels are restricted in the latently infected cells but gradually rise during proviral reactivation. ChIP assays using clones of latently infected cells demonstrate that the latent proviruses carry high levels of deacetylated histones and trimethylated histones. In contrast, the cellular genes IkappaB alpha and GAPDH had high levels of acetylated histones and no trimethylated histones. The levels of trimethylated histone H3 and HP1-alpha associated with HIV proviruses fell rapidly after tumor necrosis factor alpha activation. The progressive shutdown of HIV transcription following infection suggests that epigenetic mechanisms targeting chromatin structures selectively restrict HIV transcription initiation. This decreases Tat production below the levels that are required to sustain HIV gene expression.


Figures
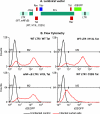
FIG. 1.
FIG. 1.
Lentiviral vectors expressing Tat and Rev in cis. (A) Genomic organization of the lentiviral vectors. A fragment of HIV-1pNL4-3, containing tat, rev, env, and vpu, was cloned into the pHR′ backbone (10). The reporter gene d2EGFP was inserted into this construct in the position of the HIV nef gene. Three additional variants of this wild-type (WT) vector were developed by inserting mutations into either the LTR (mNF-κB) or the Tat gene (H13L and C22G). (B) Flow cytometry of newly infected cells. Following the production of single-round, infectious particles using the lentiviral triple transfection system, equal titers of each virus were used to infect 1 × 10⁶ Jurkat T cells. Forty-eight hours following infection, the cells were assessed for d2EGFP expression by FACS. WT, wild type.
FIG. 2.
FIG. 2.
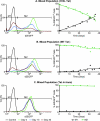
Progressive silencing of lentivirus-infected Jurkat T cells. Freshly infected, mixed populations of Jurkat T cells were sorted by FACS to obtain populations of 100% d2EGFP+ cells. d2EGFP expression for each cell population was measured by FACS during a 40-day period. (A) Silencing of cells infected with the H13L Tat vector. (B) Silencing of cells infected with the wild-type Tat vector. (C) Constant transcription of the H13L Tat vector in Jurkat C63 cells, which constitutively express Tat from a retroviral vector. The left panels show representative FACS profiles of the cell populations at various times during the experiment (i.e., uninfected Jurkat T cells [black lines]; 0 days [green lines]; 13 days [blue lines]; and 30 days [brown lines]). In order to quantitatively measure the number of cells that were infected and expressing d2EGFP, gates were set as shown on the profiles. The panels on the right show plots of the percentage of d2EGFP+ cells. The M1 region corresponds to cells that are no longer expressing d2EGFP (black lines), while the M2 region contains cells showing detectable levels of d2EGFP expression (green lines). Because of the extremely high reproducibility of the silencing rates, data for the plots were combined from three separate experiments and fitted to sigmoidal curves.
FIG. 3.
FIG. 3.
Activation of latently infected Jurkat T-cell clones by TNF-α or TSA. Cells were induced for 16 h with 10 ng/ml TNF-α or with 500 nM TSA. Clonal cell lines were isolated for vectors carrying wild-type Tat and the wild-type LTR (E4), H13L Tat and the wild-type LTR (2D10), C22G Tat and the wild-type LTR (2B2D), and H13L Tat and the mNF-κB LTR (2B5). (A) Microscope images of TNF-α-activated clones. In the left panels, DAPI (blue) and actin (red) stains were utilized in the fluorescence microscopy to identify the number of cells in the field of view. The right panels show d2EGFP expression from the same field (green). (B) Flow cytometry of clones activated by TNF-α or TSA. Black lines, cells before induction; red lines, cells induced by TNF-α; green lines, cells induced by TSA.
FIG. 4.
FIG. 4.
Individual latently infected cells show unique silencing rates but similar reactivation kinetics. (A) Jurkat T cells were infected with the H13L Tat vector, and d2EGFP-positive clones were isolated by the sorting of individual cells into the wells of 96-well microtiter plates. The graphs show the percentage of d2EGFP+ cells (M2 region) with the data fitted to sigmoidal curves to obtain accurate values for the silencing rates. Due to the time required to obtain enough cells for flow cytometry, the initial time point is 21 days following the initial sorting. Eight representative clones were monitored at weekly intervals for up to 176 days. (B) An experiment similar to that shown in panel A, but shutdown was monitored for 77 days. (C) Reactivation of clones D7, G6, 2D10, and 6. Cells were treated with TNF-α (10 ng/ml) and monitored for d2EGFP expression at 4, 6, 8, and 16 h poststimulation. (D) Shutdown of activated clones. Following the 16-h reactivation period with TNF-α, the cells were washed twice in RPMI and then assessed for d2EGFP expression at 24-h intervals for a total of 6 days. Sigmoidal curves (variable slope) were fitted to all data sets.
FIG. 5.
FIG. 5.
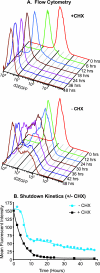
Detailed analysis of the shutdown of clone 2D10 following TNF-α reactivation. (A) Representative FACS profiles of cell populations during shutdown in the presence (+) and in the absence (−) of 0.25 μg/ml CHX. (B) Graph of the mean fluorescence intensity demonstrating progressive reductions in d2EGFP levels during the shutdown. A one-phase decay curve was fitted to the CHX-treated samples (black line), and a biphasic curve was fitted to the untreated samples (blue line).
FIG. 6.
FIG. 6.
Spontaneous reactivation and shutdown of latently infected clones. Two latently infected clones that showed measurable levels of spontaneously activated cells were sorted into populations of d2EGFP+ and d2EGFP cells (clone 6 and clone G6 in Fig. 4). FACS analysis of the cell populations immediately following cell sorting are shown by the black lines. The same cell populations were analyzed after 8 days (green lines). For comparison, the unsorted population is shown by the red lines. Each sorted population was monitored for any changes in the levels of d2EGFP expression at 24-h intervals for 8 days. The scatter plots represent the observed number of cells in each population (green triangle, d2EGFP+ sort; black squares, d2EGFP sort) that expressed d2EGFP during the time course with one-phase decay curves fitted. The dotted red line indicates the average percentage of d2EGFP+ cells seen in the unsorted clonal population over the same time period. (A) Clone 6; (B) clone G6.
FIG. 7.
FIG. 7.
Proviral reactivation requires both NF-κB and Tat expression. RNAP II levels at the HIV LTR (A), HIV env region (B), and the promoters of two control genes, IκBα (C) and GAPDH (D), were measured by ChIP assays using the N-20 antibody. Analyses were performed on clone 6 (wild-type LTR and H13L Tat), 2B2D (wild-type LTR and C22G Tat), 2B5 (mNF-κB LTR and H13L Tat), and Jurkat C63 clone 9 (wild-type LTR and H13L Tat plus wild-type Tat expressed constitutively). Cells were activated by 10 ng/ml TNF-α, and samples were taken every 15 min for the first 90 min, followed by sampling at 20-min intervals until the completion of the time course. Individual data sets were normalized to the average GAPDH level and fitted to a series of Gaussian distributions for the HIV and IκBα genes. The GAPDH data were fitted to a straight line, since the data showed no reproducible underlying periodicity.
FIG. 8.
FIG. 8.
Latent proviruses carry trimethylated histones. 2D10 cells were stimulated with 4 ng/ml of TNF-α, and samples were isolated after 30 or 150 min and compared to an unstimulated control (0 min). Samples were analyzed for changes in levels of RNAP II (A), total histone H3 (B), acetylated histone 3 (C), histone H3 trimethylated at lysine 27 (D), histone H3 trimethylated at lysine 9 (E), and HP1-α (F). In addition to looking for changes in each of these factors at the promoter-proximal region of the HIV LTR, we also examined the changes in these factors at promoter-proximal regions of the IκBα and GAPDH control genes.

Similar articles

Cited by

References

    1. Arlen, P. A., D. G. Brooks, L. Y. Gao, D. Vatakis, H. J. Brown, and J. A. Zack. 2006. Rapid expression of human immunodeficiency virus following activation of latently infected cells. J. Virol. 801599-1603. - PMC - PubMed
    1. Barboric, M., and B. M. Peterlin. 2005. A New Paradigm in eukaryotic biology: HIV Tat and the control of transcriptional elongation. PLoS Biol. 3e76. - PMC - PubMed
    1. Bourgeois, C. F., Y. K. Kim, M. J. Churcher, M. J. West, and J. Karn. 2002. Spt5 cooperates with Tat by preventing premature RNA release at terminator sequences. Mol. Cell. Biol. 221079-1093. - PMC - PubMed
    1. Brooks, D. G., P. A. Arlen, L. Gao, C. M. Kitchen, and J. A. Zack. 2003. Identification of T cell-signaling pathways that stimulate latent HIV in primary cells. Proc. Natl. Acad. Sci. USA 10012955-12960. - PMC - PubMed
    1. Brooks, D. G., S. G. Kitchen, C. M. Kitchen, D. D. Scripture-Adams, and J. A. Zack. 2001. Generation of HIV latency during thymopoiesis. Nat. Med. 7459-464. - PubMed

Publication types