

Cell cycle-dependent variation of a CD133 epitope in human embryonic stem cell, colon cancer, and melanoma cell lines
- PMID: 18829544
- PMCID: PMC2561223
- DOI: 10.1158/0008-5472.CAN-08-0723
Cell cycle-dependent variation of a CD133 epitope in human embryonic stem cell, colon cancer, and melanoma cell lines
Abstract
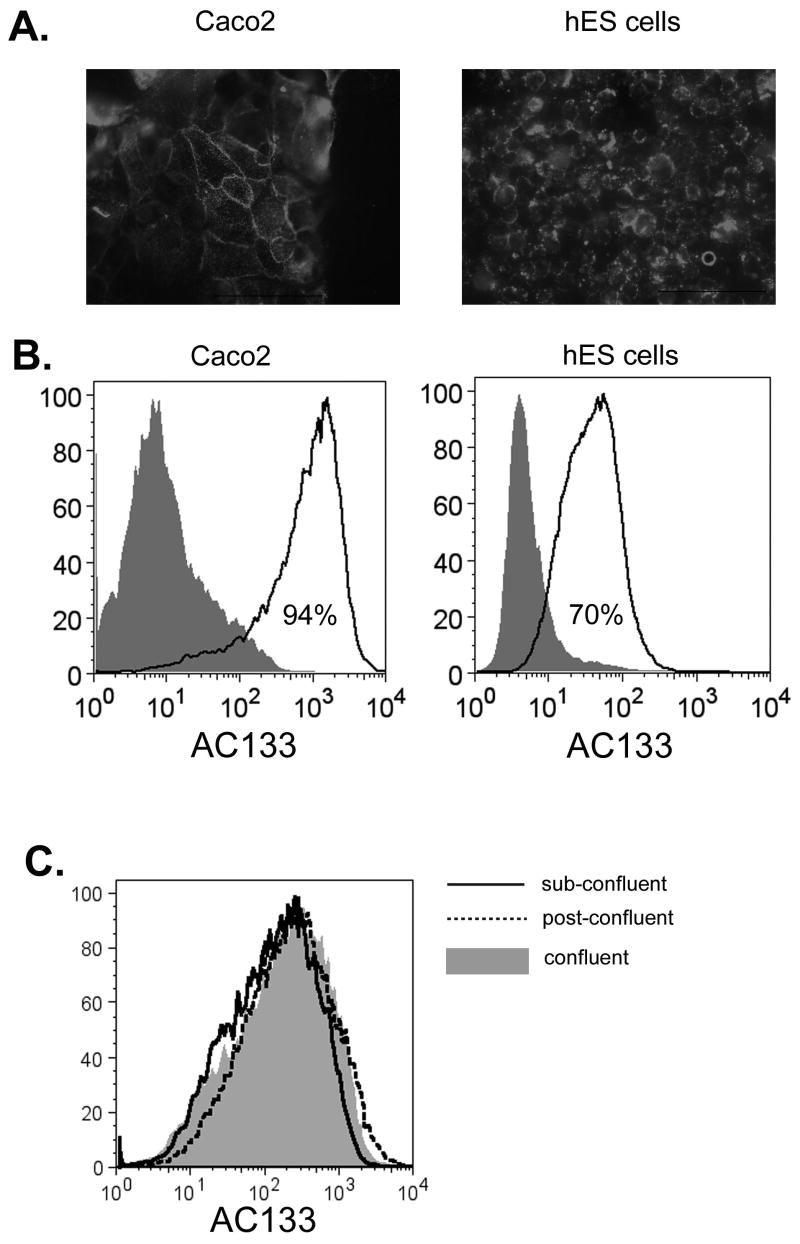
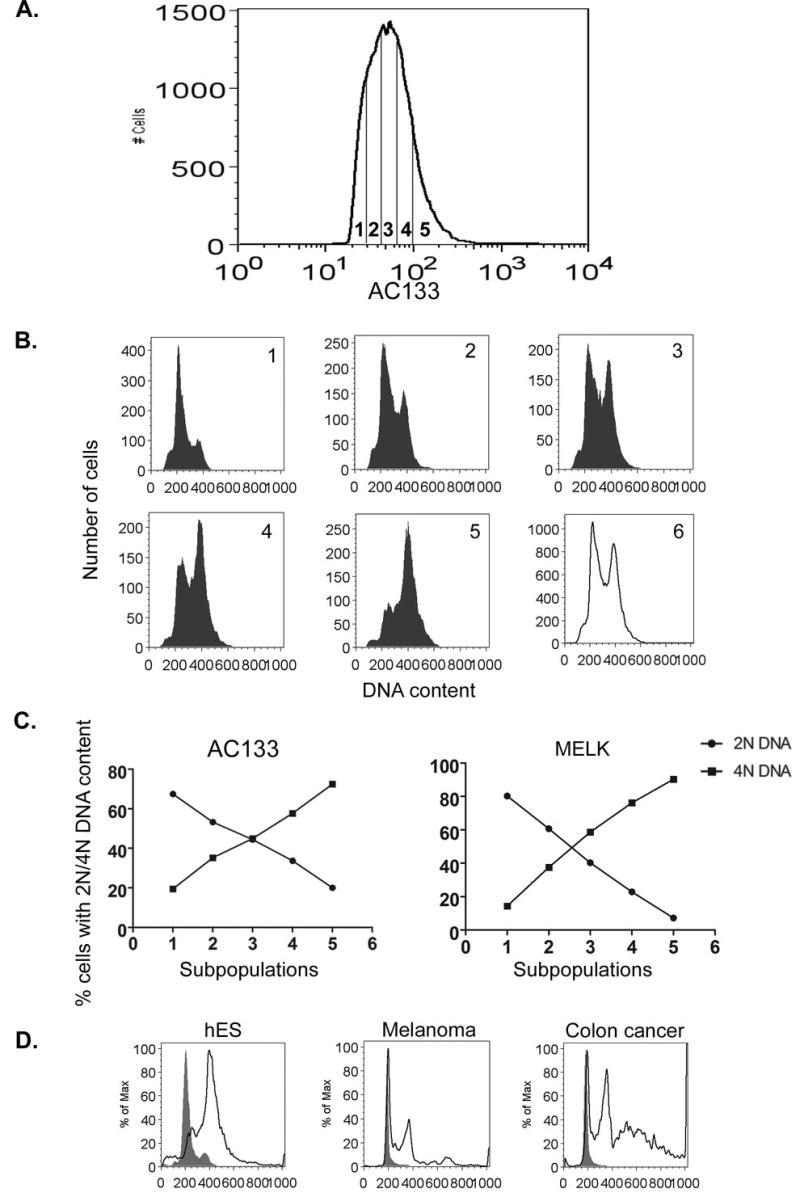
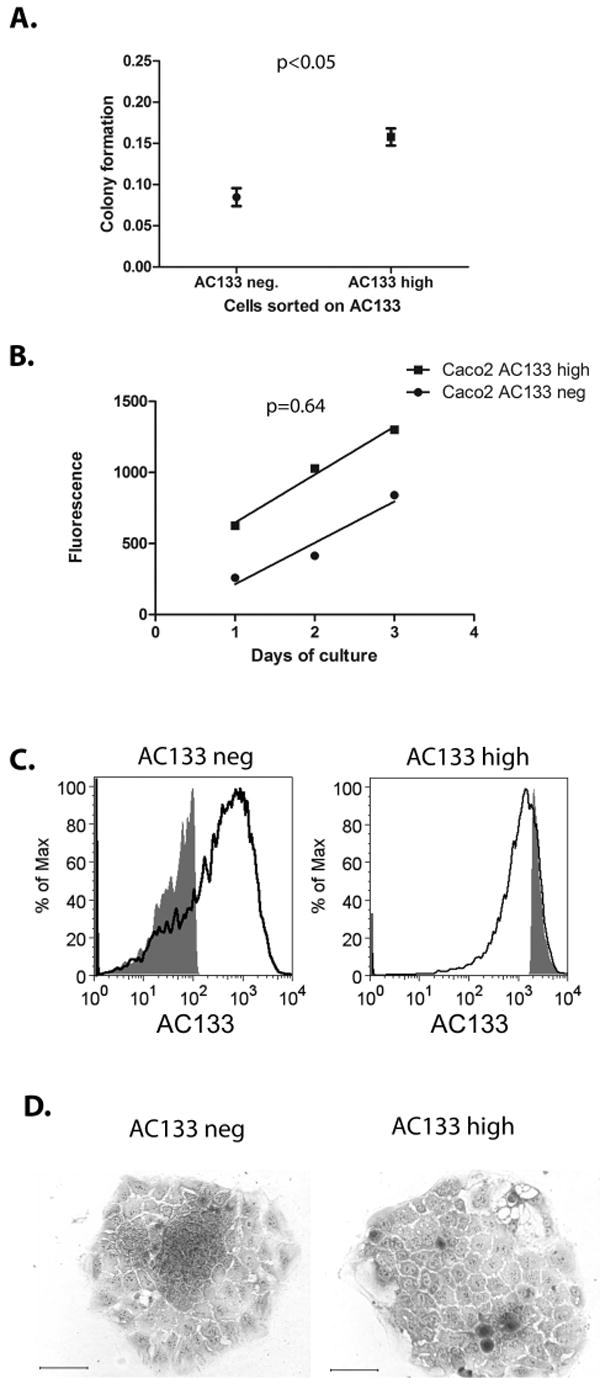
CD133 (Prominin1) is a pentaspan transmembrane glycoprotein expressed in several stem cell populations and cancers. Reactivity with an antibody (AC133) to a glycoslyated form of CD133 has been widely used for the enrichment of cells with tumor-initiating activity in xenograph transplantation assays. We have found by fluorescence-activated cell sorting that increased AC133 reactivity in human embryonic stem cells, colon cancer, and melanoma cells is correlated with increased DNA content and, reciprocally, that the least reactive cells are in the G(1)-G(0) portion of the cell cycle. Continued cultivation of cells sorted on the basis of high and low AC133 reactivity results in a normalization of the cell reactivity profiles, indicating that cells with low AC133 reactivity can generate highly reactive cells as they resume proliferation. The association of AC133 with actively cycling cells may contribute to the basis for enrichment for tumor-initiating activity.
Figures

Similar articles
-
The AC133 epitope, but not the CD133 protein, is lost upon cancer stem cell differentiation.Cancer Res. 2010 Jan 15;70(2):719-29. doi: 10.1158/0008-5472.CAN-09-1820. Epub 2010 Jan 12. Cancer Res. 2010. PMID: 20068153
-
CD133 Expression Is Not Synonymous to Immunoreactivity for AC133 and Fluctuates throughout the Cell Cycle in Glioma Stem-Like Cells.PLoS One. 2015 Jun 18;10(6):e0130519. doi: 10.1371/journal.pone.0130519. eCollection 2015. PLoS One. 2015. PMID: 26086074 Free PMC article.
-
Two novel monoclonal antibodies against human CD133-2: distinct epitopes and agonist activity to enhance growth of CD133 expression cells in vitro.Hybridoma (Larchmt). 2010 Jun;29(3):241-9. doi: 10.1089/hyb.2009.0113. Hybridoma (Larchmt). 2010. PMID: 20569000
-
Insight into the complex regulation of CD133 in glioma.Int J Cancer. 2011 Feb 1;128(3):501-10. doi: 10.1002/ijc.25687. Int J Cancer. 2011. PMID: 20853315 Review.
-
CD133: molecule of the moment.J Pathol. 2008 Jan;214(1):3-9. doi: 10.1002/path.2283. J Pathol. 2008. PMID: 18067118 Review.
Cited by
-
Characterization of the conversion between CD133+ and CD133- cells in colon cancer SW620 cell line.Cancer Biol Ther. 2012 Dec;13(14):1396-406. doi: 10.4161/cbt.22000. Epub 2012 Sep 6. Cancer Biol Ther. 2012. PMID: 22954703 Free PMC article.
-
Evaluation of immunohistochemical expression of stem cell markers (NANOG and CD133) in normal, hyperplastic, and malignant endometrium.J Med Life. 2022 Jan;15(1):117-123. doi: 10.25122/jml-2021-0206. J Med Life. 2022. PMID: 35186145 Free PMC article.
-
Characteristics and Potentiality of Human Adipose-Derived Stem Cells (hASCs) Obtained from Enzymatic Digestion of Fat Graft.Cells. 2019 Mar 25;8(3):282. doi: 10.3390/cells8030282. Cells. 2019. PMID: 30934588 Free PMC article.
-
Non-small cell lung cancer cells expressing CD44 are enriched for stem cell-like properties.PLoS One. 2010 Nov 19;5(11):e14062. doi: 10.1371/journal.pone.0014062. PLoS One. 2010. PMID: 21124918 Free PMC article.
-
Decoding the cancer stem cell hypothesis in glioblastoma.CNS Oncol. 2013 Jul;2(4):319-30. doi: 10.2217/cns.13.23. CNS Oncol. 2013. PMID: 24379973 Free PMC article.
References
-
- Ailles LE, Weissman IL. Cancer stem cells in solid tumors. Curr Opin Biotechnol. 2007;18:460–6. - PubMed
-
- Beier D, Hau P, Proescholdt M, et al. CD133(+) and CD133(-) glioblastoma-derived cancer stem cells show differential growth characteristics and molecular profiles. Cancer Res. 2007;67:4010–5. - PubMed
-
- Zheng X, Shen G, Yang X, Liu W. Most C6 cells are cancer stem cells: evidence from clonal and population analyses. Cancer Res. 2007;67:3691–7. - PubMed
-
- Miraglia S, Godfrey W, Yin AH, et al. A novel five-transmembrane hematopoietic stem cell antigen: isolation, characterization, and molecular cloning. Blood. 1997;90:5013–21. - PubMed
Publication types
MeSH terms
Substances
Grants and funding
LinkOut - more resources
Full Text Sources
Medical
Molecular Biology Databases
Research Materials
