. 2008 Oct 15;121(Pt 20):3445-58.
doi: 10.1242/jcs.031484. Epub 2008 Sep 30.

Sorting of EGF and transferrin at the plasma membrane and by cargo-specific signaling to EEA1-enriched endosomes

Affiliations

Sorting of EGF and transferrin at the plasma membrane and by cargo-specific signaling to EEA1-enriched endosomes

Deborah Leonard et al. J Cell Sci. .

Abstract

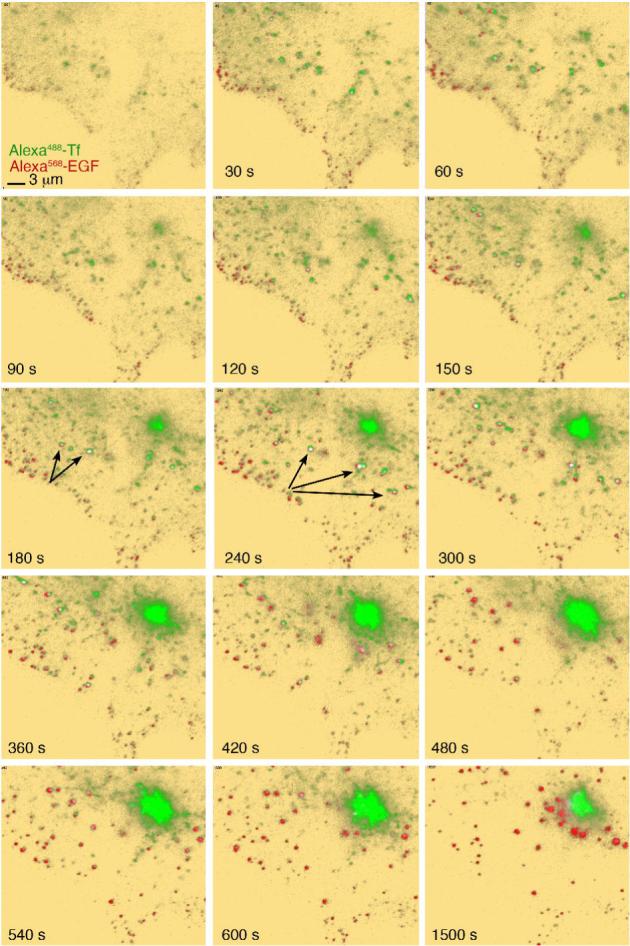
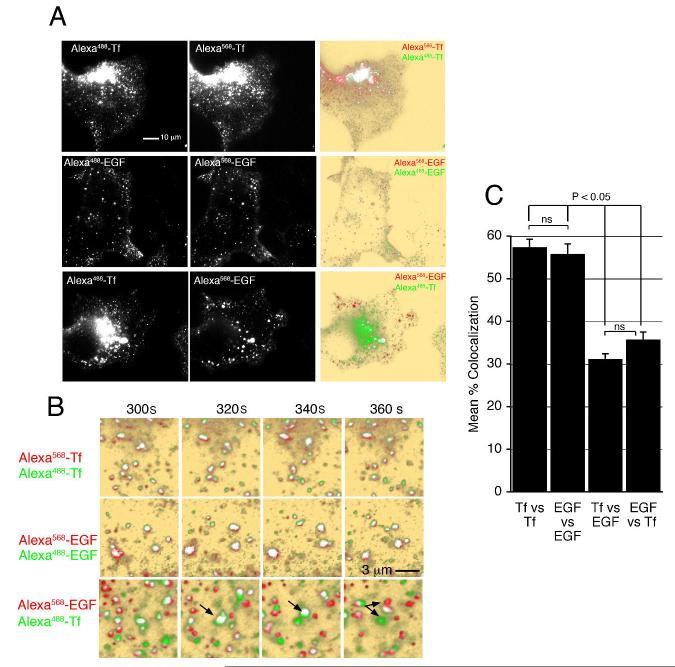
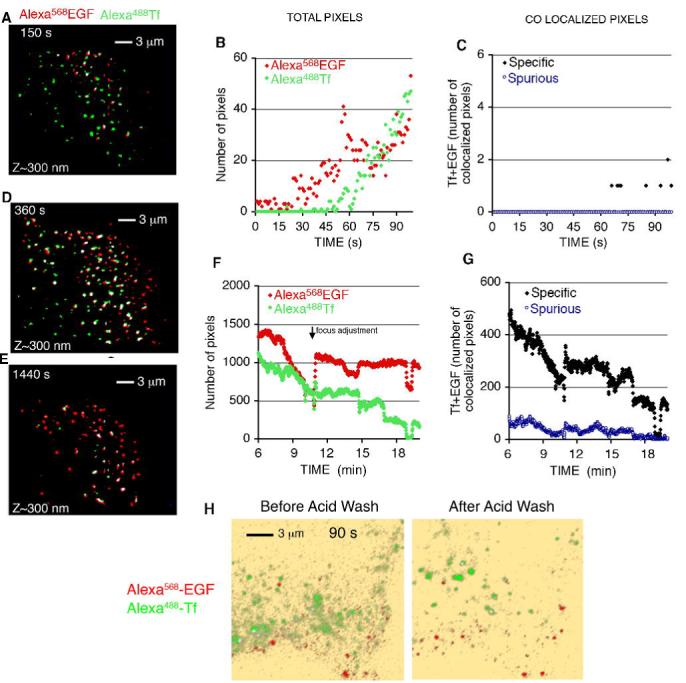
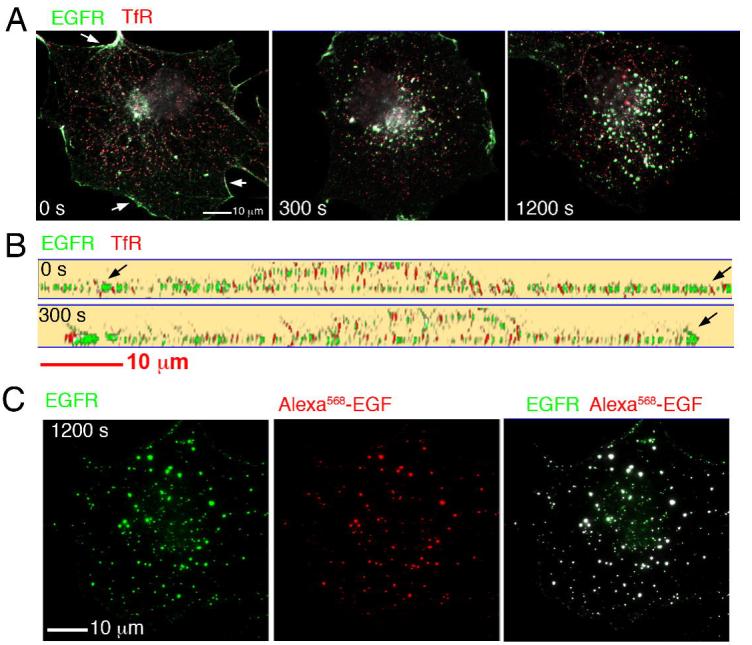
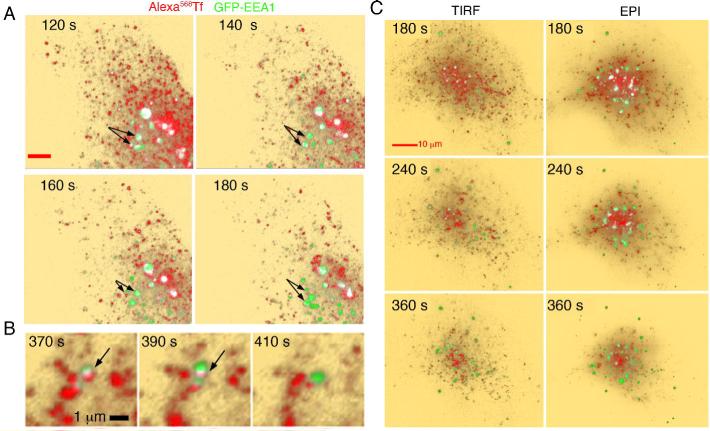
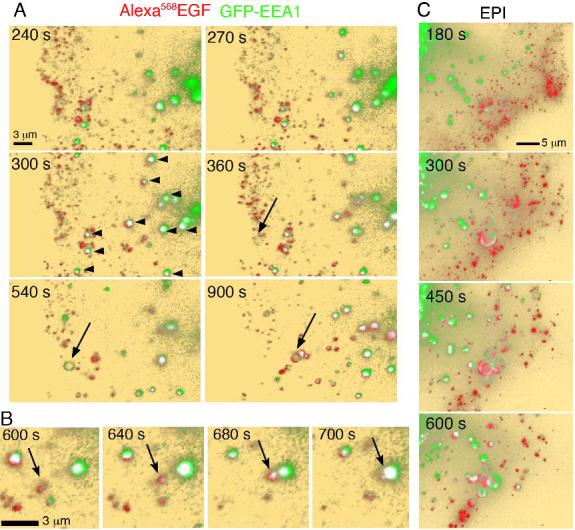
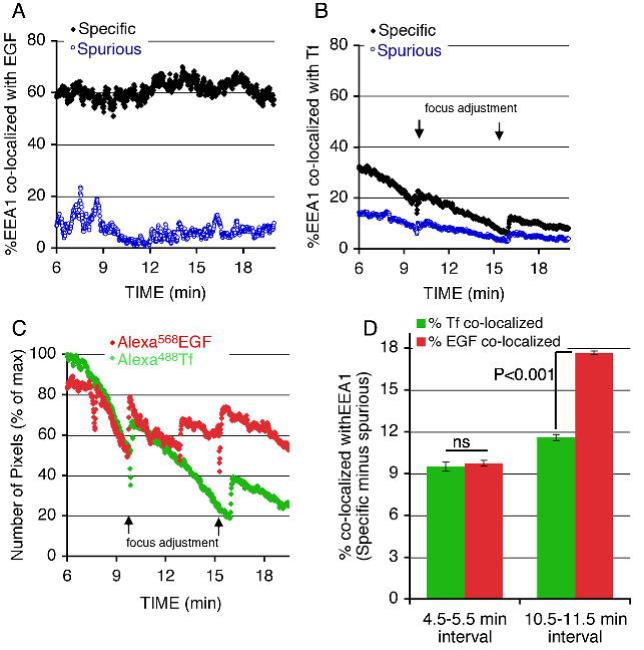
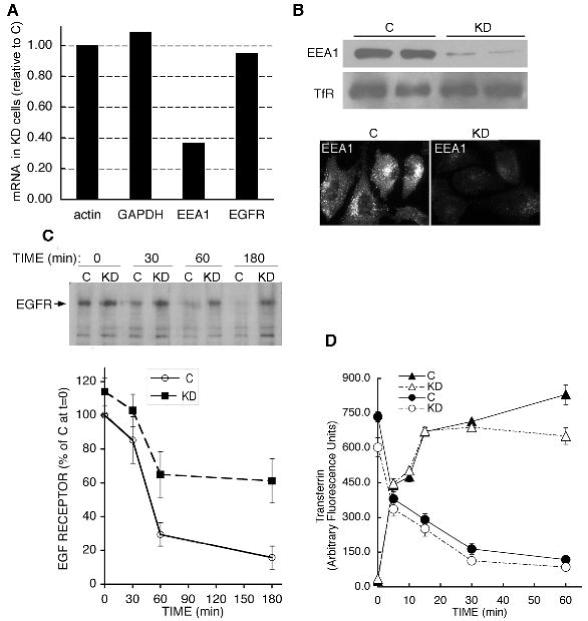
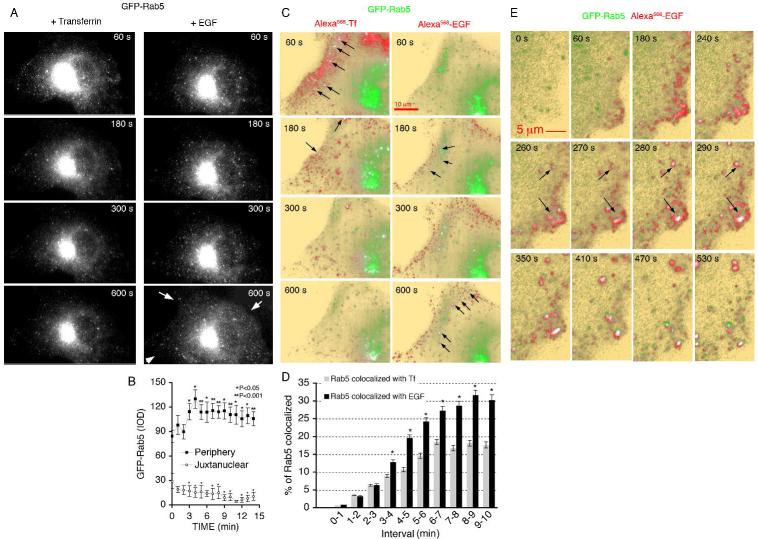
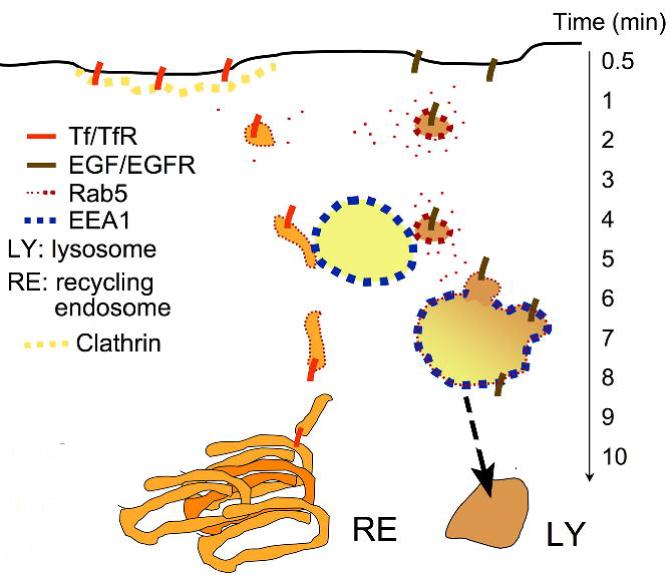
The biological function of receptors is determined by their appropriate trafficking through the endosomal pathway. Following internalization, the transferrin (Tf) receptor quantitatively recycles to the plasma membrane, whereas the epidermal growth factor (EGF) receptor undergoes degradation. To determine how Tf and EGF engage these two different pathways we imaged their binding and early endocytic pathway in live cells using total internal reflection fluorescence microscopy (TIRF-M). We find that EGF and Tf bind to distinct plasma membrane regions and are incorporated into different endocytic vesicles. After internalization, both EGF-enriched and Tf-enriched vesicles interact with endosomes containing early endosome antigen 1 (EEA1). EGF is incorporated and retained in these endosomes, while Tf-containing vesicles rapidly dissociate and move to a juxtanuclear compartment. Endocytic vesicles carrying EGF recruit more Rab5 GTPase than those carrying Tf, which, by strengthening their association with EEA1-enriched endosomes, may provide a mechanism for the observed cargo-specific sorting. These results reveal pre-endocytic sorting of Tf and EGF, a specialized role for EEA1-enriched endosomes in EGF trafficking, and a potential mechanism for cargo-specified sorting of endocytic vesicles by these endosomes.


Figures

Figure 1
Figure 1. Binding and Internalization of EGF and Tf in COS-7 cells
COS-7 cells grown on coverslips were placed in KRH buffer at 35°C, and exposed to 50 ng/ml Alexa568-EGF and 20 μg/ml Alexa488-Tf. Image capture was started immediately after ligand addition. Background is pseudo colored in yellow to enhance low level signal. Colocalized signal (arrows) is pseudo colored in white. The complete time series can be seen in Video1.
Figure 2
Figure 2. Imaging of ligand pairs conjugated to different fluorophores
A. COS-7 cells grown on coverslips were placed in KRH buffer at 35°C, and exposed to 10 μg/ml Alexa488-Tf + 10 μg/ml Alexa568-Tf (top panels), 50 ng/ml Alexa568-EGF + 50 ng/ml Alexa488-EGF (middle panels), or 50 ng/ml Alexa568-EGF + 10 μg/ml Alexa488-Tf (bottom panels) for 5 min. Overlap is shown in the right column. B. Images are from the time periods after addition of ligands indicated above the panels. Arrows indicate the clear segregation of signals seen in cells incubated with different ligands, that is not seen with the same ligand conjugated to two different fluorophores. C. Quantification of signal overlap between fluorophores after 5 min of exposure. Bars are the mean and lines represent S.E.M. of 5 different experiments. Statistical significance of the differences between groups was estimated using 2 tailed Student t-tests.
Figure 3
Figure 3. Quantification of the dynamics of EGF and Tf binding, internalization and co-localization
COS-7 cells grown on coverslips were placed in KRH buffer at 35°C, and exposed to 50 ng/ml Alexa568-EGF and 20 μg/ml Alexa488-Tf. Image capture was started immediately after ligand addition, with the incident angle of the laser set to visualize ∼100 nm from the coverslip. After 2 min, cells were washed twice with KRH and the incident angle modified to visualize ∼300 nm into the cell. Masked, overlapped images from several time points are shown in A,D and E. The number of total pixels of each fluorophore (B,F), as well as the number of co-localized pixels (C,G) seen at early time points after ligand addition (B,C), and after the wash step (F,G) are plotted over time after ligand addition. Results are from a single image set which is representative of a minimum of 5 independent experiments. H. Cells were exposed to ligands for 90 s, imaged, washed in cold PBS, exposed to an acid wash solution consisting of PBS containing 50 mM sodium acetate pH 4.0 for 3 min, and re-imaged.
Figure 4
Figure 4
A. COS-7 cells were exposed to unlabed EGF and Tf for the times indicated, fixed and stained with antibodies to the EGFR and the TFR. Optical sections were obtained at 250 nm intervals through the entire volume of the cell, and projected into a single 2D image. A clear demarcation of the cell edge was seen with antibodies to EGFR (arrows), but not to the TfR. B. 130 nm optical slices through the thickest part of the nucleus of cells treated and stained as in A. C. Cells were exposed to Alexa568-EGF for 20 min, fixed, and stained with antibodies to the EGFR. Optical sections were obtained at 250 nm intervals through the entire volume of the cell, and projected into a single 2D image.
Figure 5
Figure 5. Imaging of Tf and EEA1
A. COS-7 cells expressing GFP-EEA1 (green) were exposed to 10 μg/ml Alexa568-Tf (red) for the times indicated in each panel. After 60 s cells were washed, incubated with 200μg/ml unlabeled Tf, and imaged by TIRF-M with an incident angle set to visualize 300 nm from the coverslip. Co-localized voxels are depicted in white. B. Higher resolution series depicting the transient nature of the co-localization of Tf with EEA1. C. TIRF images were obtained at 0.5 Hz, and at 60 s intervals illumination was switched to epifluorescence for the acquisition of optical sections at 250 nm intervals through the entire cell volume. Shown is the TIRF image preceding the acquisition of the image stack. Optical sections were projected into a single 2D image.
Figure 6
Figure 6. Imaging of EGF and EEA1
A. COS-7 cells expressing GFP-EEA1 (green) were exposed to 50 ng/ml Alexa568-EGF (red) and imaged for the times after ligand addition indicated in each panel. After 3 min cells were washed and imaged by TIRF-M with an incident angle set to visualize 300 nm from the coverslip. Co-localized voxels are depicted in white, and indicated with arrowheads. Arrows point to the appearance of a ring-like structure containing EEA1, to which EGF-containing vesicles appear to attach. B. Higher resolution series depicting the association of EGF-containing vesicles (arrow) with EEA1-enriched endosomes. C. Optical sections at 250 nm intervals through the entire cell volume were projected into a single 2D images.
Figure 7
Figure 7. Quantification of EGF and Tf co-localization with EEA1
COS-7 cells expressing GFP-EEA1 were exposed to 50 ng/ml Alexa568-EGF (A,C) or 10 μg/ml Alexa568-Tf (B,C) for 5 min, after which fluorophores were washed and unlabeled Tf added at a concentration of 200 μg/ml (B,C). Plotted are the percent of total EEA1 pixels co-localized with EGF (A) or Tf (B) over time. C. Number of total pixels of each fluorophore over time, normalized to the maximum seen immediately after the wash step. D. Percent of Tf or EGF pixels colocalized with EEA1 in regions containing both fluorophores at indicated times after exposure to ligands. Results are from a single image set which is representative of a minimum of 5 independent experiments.
Figure 8
Figure 8. Effect of EEA1 knockdown on Tf and EGF trafficking
A. Real time quantitative PCR in Hela cells stably expressing a scrambled control (C) or an EEA1-directed (KD) shRNA. The mRNAs examined are indicated along the X-axis. B. Western blotting of EEA1 and TfR in two independent stable clones, and immunofluorescence analysis of EEA1. C. Cells were serum starved and incubated in the presence of EGF for the times indicated. Extracts were analyzed by western blotting with anti-EGFR antibodies. Plotted are the means and lines represent SEM of four independent experiments analyzed by densitometric scanning. D. Kinetics of Tf uptake and recycling in C and KD cells. Plotted are means and lines are SEM of three experiments performed in duplicate.
Figure 9
Figure 9. Imaging of GFP-Rab5c, Tf and EGF
A-C. COS-7 cells expressing GFP-Rab5c were exposed to Alexa568-Tf for 3 min followed by a wash and addition of unlabeled Tf at a concentration of 200 μg/ml. Cells were imaged continuously by TIRF-M alternating with epifluorescence as described above. After 30 min, when the vast majority of the Tf signal had disappeared from the cell, Alexa568-EGF was added, and imaging resumed. Shown in A are optical sections through the cell in the GFP channel, illustrating the distribution of Rab5 in the 3 dimensional volume of the cell. Arrows point to the redistribution of Rab5 to the cell periphery in reponse to EGF. B. The mean intensity of Rab5 in the peripheral and juxtanuclear regions over time after exposure to EGF was quantified in 5 independent cells. C. TIRF images of the fluorescent ligands superimposed on the Rab5 image. Arrows point to regions of co-localization. D. Co-localization between Rab5-GFP and Alexa568-EGF or Alexa568-Tf over time. Plotted are the percent of Rab5 co-localized with each ligand in pixel-dense regions (2-3 regions per cell) over the indicated time intervals. Bars are the means, and lines the S.E.M. of three independent experiments. Statistical significance was calculated from paired two-tailed student t-tests. *P< 0.001. E. Sequence of images of a cell expressing GFP-Rab5 and exposed to Alexa568-EGF for the times shown in each panel. Arrows point to regions containing Alexa568-EGF, which acquire GFP-Rab5. Similar results were observed in a minimum of 5 independent experiments.
Figure 10
Figure 10. Model for Tf and EGF internalization and sorting relative to EEA1
The majority of liganded EGFR and TfR internalize through distinct plasma membrane regions, entering into vesicles that contain Rab5. The active EGFR recruits more Rab5 resulting in a higher density of this GTPase in EGF-containing vesicles compared to Tf-containing vesicles. Both types of vesicles interact with EEA1-enriched endosomes, but only EGF-containing vesicles can interact strongly, and fuse. Tf/TfR-containing vesicles move to the perinuclear recycling endosome, while the EGF/EGFR complex is now sequestered by EEA1-enriched endosomes. In this model, EEA1 marks the entry point into the degradative pathway.

Similar articles

Cited by

References

    1. Axelrod D. Total internal reflection fluorescence microscopy in cell biology. Traffic. 2001;2:764–74. - PubMed
    1. Axelrod D. Total internal reflection fluorescence microscopy in cell biology. Methods Enzymol. 2003;361:1–33. - PubMed
    1. Bache KG, Brech A, Mehlum A, Stenmark H. Hrs regulates multivesicular body formation via ESCRT recruitment to endosomes. J Cell Biol. 2003;162:435–42. - PMC - PubMed
    1. Bache KG, Stuffers S, Malerod L, Slagsvold T, Raiborg C, Lechardeur D, Walchli S, Lukacs GL, Brech A, Stenmark H, et al. The ESCRT-III Subunit hVps24 Is Required for Degradation but Not Silencing of the Epidermal Growth Factor Receptor. Mol Biol Cell. 2006;17:2513–2523. - PMC - PubMed
    1. Barbieri MA, Fernandez-Pol S, Hunker C, Horazdovsky BH, Stahl PD. Role of rab5 in EGF receptor-mediated signal transduction. Eur J Cell Biol. 2004;83:305–14. - PubMed

Publication types