Systems-level metabolic flux profiling identifies fatty acid synthesis as a target for antiviral therapy
- PMID: 18820684
- PMCID: PMC2825756
- DOI: 10.1038/nbt.1500
Systems-level metabolic flux profiling identifies fatty acid synthesis as a target for antiviral therapy
Abstract
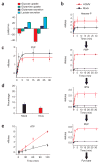
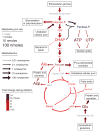
Viruses rely on the metabolic network of their cellular hosts to provide energy and building blocks for viral replication. We developed a flux measurement approach based on liquid chromatography-tandem mass spectrometry to quantify changes in metabolic activity induced by human cytomegalovirus (HCMV). This approach reliably elucidated fluxes in cultured mammalian cells by monitoring metabolome labeling kinetics after feeding cells (13)C-labeled forms of glucose and glutamine. Infection with HCMV markedly upregulated flux through much of the central carbon metabolism, including glycolysis. Particularly notable increases occurred in flux through the tricarboxylic acid cycle and its efflux to the fatty acid biosynthesis pathway. Pharmacological inhibition of fatty acid biosynthesis suppressed the replication of both HCMV and influenza A, another enveloped virus. These results show that fatty acid synthesis is essential for the replication of two divergent enveloped viruses and that systems-level metabolic flux profiling can identify metabolic targets for antiviral therapy.
Figures


Comment in
-
From biomarkers to integrated network responses.Nat Biotechnol. 2008 Oct;26(10):1090-2. doi: 10.1038/nbt1008-1090. Nat Biotechnol. 2008. PMID: 18846075 No abstract available.
Similar articles
-
From biomarkers to integrated network responses.Nat Biotechnol. 2008 Oct;26(10):1090-2. doi: 10.1038/nbt1008-1090. Nat Biotechnol. 2008. PMID: 18846075 No abstract available.
-
Viral effects on metabolism: changes in glucose and glutamine utilization during human cytomegalovirus infection.Trends Microbiol. 2011 Jul;19(7):360-7. doi: 10.1016/j.tim.2011.04.002. Epub 2011 May 12. Trends Microbiol. 2011. PMID: 21570293 Free PMC article. Review.
-
Computational analysis of storage synthesis in developing Brassica napus L. (oilseed rape) embryos: flux variability analysis in relation to ¹³C metabolic flux analysis.Plant J. 2011 Aug;67(3):513-25. doi: 10.1111/j.1365-313X.2011.04611.x. Epub 2011 May 31. Plant J. 2011. PMID: 21501261
-
Viruses and metabolism: alterations of glucose and glutamine metabolism mediated by human cytomegalovirus.Adv Virus Res. 2011;80:49-67. doi: 10.1016/B978-0-12-385987-7.00003-8. Adv Virus Res. 2011. PMID: 21762821
-
Metabolomics in drug target discovery.Cold Spring Harb Symp Quant Biol. 2011;76:235-46. doi: 10.1101/sqb.2011.76.010694. Epub 2011 Nov 23. Cold Spring Harb Symp Quant Biol. 2011. PMID: 22114327 Free PMC article. Review.
Cited by
-
Dengue and metabolomics in humans.Metabolomics. 2021 Mar 12;17(3):34. doi: 10.1007/s11306-021-01783-6. Metabolomics. 2021. PMID: 33712974 Review.
-
Palmitic Acid Promotes Virus Replication in Fish Cell by Modulating Autophagy Flux and TBK1-IRF3/7 Pathway.Front Immunol. 2020 Aug 5;11:1764. doi: 10.3389/fimmu.2020.01764. eCollection 2020. Front Immunol. 2020. PMID: 32849631 Free PMC article.
-
The Cytomegalovirus protein pUL37×1 targets mitochondria to mediate neuroprotection.Sci Rep. 2016 Aug 26;6:31373. doi: 10.1038/srep31373. Sci Rep. 2016. PMID: 27562039 Free PMC article.
-
Human cytomegalovirus induces neuronal enolase to support virally mediated metabolic remodeling.Proc Natl Acad Sci U S A. 2022 Dec 6;119(49):e2205789119. doi: 10.1073/pnas.2205789119. Epub 2022 Dec 2. Proc Natl Acad Sci U S A. 2022. PMID: 36459650 Free PMC article.
-
Overcoming nutrient limitations for cell-based production of influenza vaccine.Hum Vaccin Immunother. 2015;11(7):1685-8. doi: 10.1080/21645515.2015.1044182. Hum Vaccin Immunother. 2015. PMID: 26061797 Free PMC article.
References
-
- Fiehn O. Metabolomics–the link between genotypes and phenotypes. Plant Mol Biol. 2002;48:155–171. - PubMed
-
- Nicholson JK, Connelly J, Lindon JC, Holmes E. Metabonomics: a platform for studying drug toxicity and gene function. Nat Rev Drug Discov. 2002;1:153–161. - PubMed
-
- Wikoff WR, Gangoiti JA, Barshop BA, Siuzdak G. Metabolomics identifies perturbations in human disorders of propionate metabolism. Clin Chem. 2007;53:2037–2039. - PubMed
Publication types
MeSH terms
Substances
Grants and funding
- AI068678/AI/NIAID NIH HHS/United States
- R01 CA082396/CA/NCI NIH HHS/United States
- R01 AI078063-03/AI/NIAID NIH HHS/United States
- CA85786/CA/NCI NIH HHS/United States
- 5 P50 GM071508/GM/NIGMS NIH HHS/United States
- R01 CA085786/CA/NCI NIH HHS/United States
- R01 CA085786-01/CA/NCI NIH HHS/United States
- P50 GM071508/GM/NIGMS NIH HHS/United States
- R01 CA082396-11/CA/NCI NIH HHS/United States
- P50 GM071508-01/GM/NIGMS NIH HHS/United States
- CA82396/CA/NCI NIH HHS/United States
- R01 AI078063/AI/NIAID NIH HHS/United States
LinkOut - more resources
Full Text Sources
Other Literature Sources

