. 2008 Sep 29;205(10):2419-35.
doi: 10.1084/jem.20072327. Epub 2008 Sep 22.

The p110 delta of PI3K plays a critical role in NK cell terminal maturation and cytokine/chemokine generation

Affiliations

The p110 delta of PI3K plays a critical role in NK cell terminal maturation and cytokine/chemokine generation

Hailong Guo et al. J Exp Med. .

Abstract

Phosphatidylinositol 3-kinases (PI3Ks) play a critical role in regulating B cell receptor- and T cell receptor-mediated signaling. However, their role in natural killer (NK) cell development and functions is not well understood. Using mice expressing p110 delta(D910A), a catalytically inactive p110 delta, we show that these mice had reduced NK cellularity, defective Ly49C and Ly49I NK subset maturation, and decreased CD27(High) NK numbers. p110 delta inactivation marginally impaired NK-mediated cytotoxicity against tumor cells in vitro and in vivo. However, NKG2D, Ly49D, and NK1.1 receptor-mediated cytokine and chemokine generation by NK cells was severely affected in these mice. Further, p110 delta(D910A/D910A) NK cell-mediated antiviral responses through natural cytotoxicity receptor 1 were reduced. Analysis of signaling events demonstrates that p110 delta(D910A/D910A) NK cells had a reduced c-Jun N-terminal kinase 1/2 phosphorylation in response to NKG2D-mediated activation. These results reveal a previously unrecognized role of PI3K-p110 delta in NK cell development and effector functions.


Figures

Figure 1.
Figure 1.
Phenotypic characterization of p110δD910A/D910A mice. (a) Expression levels of PI3K subunits were unaltered after the catalytic inactivation of p110δ. Expression of p110 and total p85 and p85α isoforms was analyzed by Western blotting in IL-2–activated splenic and BM NK cells. (b) Absolute numbers of spleen and BM cells are significantly reduced in p110δD910A/D910A mice. Total cellularity of the spleen and BM was calculated from 10 mice in each genotype. (c) Absolute CD3NK1.1+ cell number is decreased in p110δD910A/D910A mice. Single-cell suspensions were stained with anti-NK1.1 and anti-CD3ε mAbs. NK cells as specified by CD3NK1.1+ positivity were gated and analyzed for absolute numbers. Data shown were obtained using cells from seven mice of each genotype. (d) Expression of early developmental markers in fresh p110δD910A/D910A BM NK cells. Percentages of positive NK cells for each marker among CD3NK1.1+ cells are shown. Gates were set using unstained or nonspecific isotype mAb controls (not depicted). Data presented were means obtained from seven mice of each genotype. Data presented were means and standard deviations from three to five experiments.
Figure 2.
Figure 2.
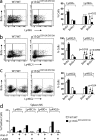
Catalytic inactivation of p110δ results in impaired maturation of Ly49C and Ly49I NK subsets. Expression of maturation markers on p110δD910A/D910A NK cells was analyzed by flow cytometry. Percentages of Ly49C/I+ NK subset are significantly reduced on both fresh BM (a) and splenic (b) p110δD910A/D910A NK cells. Percentages of Ly49C/I+ or Ly49I+ NK subset are significantly reduced in the IL-2–activated BM (c) or splenic (d) p110δD910A/D910A NK cells that were stained with anti–Ly49C/I-PE or anti–Ly49I-PE mAbs in combination with anti–Ly49G2-allophycocyanin, or anti–Ly49A-PE in combination with anti–Ly49D-FITC mAbs. Percentages of each NK subset are shown. NK cells from seven (a and b) or three (c and d) mice of each genotype were used. Data shown were obtained from three to five independent experiments.
Figure 3.
Figure 3.
Defective proliferation but not increased apoptosis affects the Ly49C/I NK subsets in p110δD910A/D910A mice. IL-2–cultured splenic NK cells were pulsed with BrdU as in Materials and methods. 4 h later, NK cells were stained and analyzed for Ly49A (a), Ly49C/I (b), and Ly49G2 (c) subset proliferation. The percentages of BrdU-positive and -negative Ly49 subsets are also shown as histograms (a–c, right). Data presented are mean values from three mice of each genotype. (d) IL-2–cultured splenic NK cells were stained with Annexin V and 7-AAD for apoptosis analysis of each Ly49 NK subset. Data presented are mean values from three mice of each genotype. One representative of three independent experiments is shown.
Figure 4.
Figure 4.
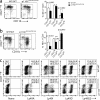
Catalytic inactivation of p110δ reduces CD27High NK subsets. BM- (a) or spleen- (b) derived CD3NK1.1+ NK cells were analyzed for CD11b and CD27 expression. The percentages of CD27HighCD11bLow, CD27HighCD11bHigh, and CD27LowCD11bHigh cells were calculated. Data are means ± SD. (c) Alteration in CD27High NK subsets correlates with the reduction in Ly49C/I NK subsets. Spleen-derived single-cell suspensions were stained with anti-NK1.1, anti-CD3ε, and each of the indicated anti-Ly49 or CD11b and CD27 mAbs. NK cells as specified by CD3NK1.1+ positivity were gated and analyzed. Data shown were obtained using cells from five to seven mice of each genotype. One representative out of three independent experiments is shown.
Figure 5.
Figure 5.
Ex vivo– and IL-2–activated p110δD910A/D910A NK cell cytotoxicity are moderately impaired. (a) Fresh splenic NK cells were purified and used in a 4-h 51Cr-release assay using EL4H60 target cells. (b) IL-2–activated splenic NK cells were tested against 51Cr-labeled target cells at the indicated effector/target (E/T) ratios. Cytotoxicity was tested against EL4, EL4H60, YAC-1, RMA/S, or CHO cells. Three to five mice were used for each genotype. Open and closed circles represent the mean values from WT/WT and p110δD910A/D910A mice, respectively. NKG2D-mediated cytotoxic potential of the Ly49C/I+ NK subset was more severely impaired compared with Ly49C/I NK subsets. (c) Ly49C/I+Ly49G2±, (d) Ly49C/ILy49G2+, and (e) Ly49C/ILy49G2 NK subsets were sorted from IL-2–activated splenic NK cells derived from WT/WT and p110δD910A/D910A mice, rested for 12 h, and used in cytotoxicity assays with EL4H60 as target cells. Data presented are means ± SD (a and b) or are representative (c–e) of at least three independent experiments.
Figure 6.
Figure 6.
Ability of ex vivo– and IL-2–activated p110δD910A/D910A NK cells to generate cytokines or chemokines is severely impaired. (a) 105 freshly purified splenic CD3NK1.1+ NK cells per well were activated with plate-bound anti-NKG2D (A10), anti-Ly49D (4D11), or anti-NK1.1 (PK136) mAbs, and the supernatants were tested for the indicated cytokines and chemokines in Multiplex assays. (b) 105 IL-2–activated splenic NK cells per well were activated with plate-bound anti-NKG2D (A10), anti-Ly49D (4D11), or anti-NK1.1 (PK136) mAbs, and the resulting supernatants were used in Multiplex assays. Data presented are mean values ± SD from six mice of each genotype from two independent experiments.
Figure 7.
Figure 7.
IFN-γ generation by p110δD910A/D910A NK cells were defective in all Ly49 subsets. (a) Levels of intracellular IFN-γ positivity are significantly reduced in p110δD910A/D910A NK cells. IL-2–activated splenic NK cells were stimulated with plate-bound anti-NKG2D (A10) mAb for 8 h, combined with Brefeldin A, and incubated for another 4 h. Activated NK cells stained for intracellular IFN-γ. Cells shown are gated for the CD3NK1.1+ NK population. (b) Levels of intracellular IFN-γ positivity in different Ly49 subsets from WT and p110δD910A/D910A mice. Percentages of CD3NK1.1+ NK cells that were positive for intracellular IFN-γ are shown with Ly49 markers. Data presented are representative of three independent experiments.
Figure 8.
Figure 8.
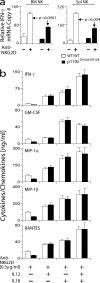
Defect in cytokine production occurs at the transcriptional level, and IL-12/IL-18–mediated generation of cytokine/chemokine is intact in p110δD910A/D910A NK cells. (a) IFN-γ–encoding mRNA levels were reduced in p110δD910A/D910A NK cells. NK cells were stimulated with anti-NKG2D mAb for 6 h, and mRNA was extracted and IFN-γ–encoding transcripts were quantified. (b) NK cell cytokine and chemokine production upon stimulation with a suboptimal concentration of anti-NKG2D mAbs in the presence or absence of IL-12, IL-18, or both. Data presented are means ± SD and are representative of three independent experiments.
Figure 9.
Figure 9.
NK cells from p110δD910A/D910A mice have a decreased ability to mediate cytotoxicity and produce cytokines against influenza virus infection. (a) LA4 cells were infected with PR8 at an MOI of 0.05. 24 h after infection, expression of HA was quantified using anti-HA mAb by flow cytometry. (b) Recognition of PR8-infected LA4 cells by p110δD910A/D910A NK cells is impaired. LA4 was infected with PR8 at an MOI of 0.05 for 24 h, labeled with 51Cr, and used for cytotoxicity assays. Data presented are the mean values from three WT/WT and p110δD910A/D910A mice, respectively. (c) p110δD910A/D910A NK cells have severely impaired ability to lyse infected LA4 cells, as shown by direct observation of cytolysis. LA4 cells were infected with PR8 at an MOI of 0.05 for 1 h, and NK cells were added and co-cultured for 8 h. Lysis of the infected LA4 monolayer was observed under light microscopy and recorded with a mounted camera. Bars, 12 μm. (d) p110δD910A/D910A NK cells generate significantly lower levels of cytokines when co-cultured with PR8-infected LA4 cells. Generation of IFN-γ and GM-CSF was quantified in the supernatants of PR8-infected LA4/NK cell co-cultures collected at 24 h after infection. Data presented were either one representative or means, and mean values of three to five experiments.
Figure 10.
Figure 10.
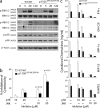
JNK1/2 regulates cytotoxicity and cytokine generation downstream of p110δ. (a) IL-2–cultured NK cells were stimulated with plate-bound anti-NKG2D mAb for the indicated times. Phosphorylation of ERK1/2, JNK1/2, and p38 was detected by Western blotting. One representative experiment out of three is shown. (b) Inhibition of cytotoxicity against EL4H60 by p38 inhibitor(SB 202190) or JNK1/2 inhibitor (SP600125). (c) Inhibition of cytokine/chemokine generation upon stimulation with plate-bound anti-NKG2D mAb by p38 inhibitor (SB 202190) or JNK1/2 inhibitor (SP600125). Data presented in b and c were means ± SD obtained from three mice of each genotype. Data shown were obtained from three to five independent experiments.

Similar articles

Cited by

References

    1. Lanier, L.L. 2005. NK cell recognition. Annu. Rev. Immunol. 23:225–274. - PubMed
    1. Groh, V., S. Bahram, S. Bauer, A. Herman, M. Beauchamp, and T. Spies. 1996. Cell stress-regulated human major histocompatibility complex class I gene expressed in gastrointestinal epithelium. Proc. Natl. Acad. Sci. USA. 93:12445–12450. - PMC - PubMed
    1. Cosman, D., J. Mullberg, C.L. Sutherland, W. Chin, R. Armitage, W. Fanslow, M. Kubin, and N.J. Chalupny. 2001. ULBPs, novel MHC class I-related molecules, bind to CMV glycoprotein UL16 and stimulate NK cytotoxicity through the NKG2D receptor. Immunity. 14:123–133. - PubMed
    1. Diefenbach, A., A.M. Jamieson, S.D. Liu, N. Shastri, and D.H. Raulet. 2000. Ligands for the murine NKG2D receptor: expression by tumor cells and activation of NK cells and macrophages. Nat. Immunol. 1:119–126. - PubMed
    1. Cerwenka, A., A.B. Bakker, T. McClanahan, J. Wagner, J. Wu, J.H. Phillips, and L.L. Lanier. 2000. Retinoic acid early inducible genes define a ligand family for the activating NKG2D receptor in mice. Immunity. 12:721–727. - PubMed

Publication types

MeSH terms