. 2008 Sep 29;205(10):2221-34.
doi: 10.1084/jem.20071190. Epub 2008 Sep 15.

Human squamous cell carcinomas evade the immune response by down-regulation of vascular E-selectin and recruitment of regulatory T cells

Affiliations

Human squamous cell carcinomas evade the immune response by down-regulation of vascular E-selectin and recruitment of regulatory T cells

Rachael A Clark et al. J Exp Med. .

Abstract

Squamous cell carcinomas (SCCs) of the skin are sun-induced skin cancers that are particularly numerous in patients on T cell immunosuppression. We found that blood vessels in SCCs did not express E-selectin, and tumors contained few cutaneous lymphocyte antigen (CLA)(+) T cells, the cell type thought to provide cutaneous immunosurveillance. Tumors treated with the Toll-like receptor (TLR)7 agonist imiquimod before excision showed induction of E-selectin on tumor vessels, recruitment of CLA(+) CD8(+) T cells, and histological evidence of tumor regression. SCCs treated in vitro with imiquimod also expressed vascular E-selectin. Approximately 50% of the T cells infiltrating untreated SCCs were FOXP3(+) regulatory T (T reg) cells. Imiquimod-treated tumors contained a decreased percentage of T reg cells, and these cells produced less FOXP3, interleukin (IL)-10, and transforming growth factor (TGF)-beta. Treatment of T reg cells in vitro with imiquimod inhibited their suppressive activity and reduced FOXP3, CD39, CD73, IL-10, and TGF-beta by indirect mechanisms. In vivo and in vitro treatment with imiquimod also induced IL-6 production by effector T cells. In summary, we find that SCCs evade the immune response at least in part by down-regulating vascular E-selectin and recruiting T reg cells. TLR7 agonists neutralized both of these strategies, supporting their use in SCCs and other tumors with similar immune defects.


Figures

Figure 1.
Figure 1.
T cells infiltrating SCCs are noncutaneous central memory T cells. (A) T cells isolated from SCCs were memory (CD45RO+) Th1-biased T cells that lacked expression of skin-homing addressins (CLA, CCR4) and instead expressed markers characteristic of central memory T cells (L-selectin/CCR7), a cell type that is usually restricted to blood or lymph nodes. In contrast, T cells from normal human skin expressed high levels of the skin-homing addressins CLA and CCR4 and most lacked CCR7/L-selectin coexpression. Similar results were observed in three additional SCC samples. (B) Confirmation that T cells infiltrating SCCs lack CLA expression. Frozen sections of invasive SCCs were stained for CD3 (red) and CLA (green). Only a small number of T cells infiltrating SCCs were skin-homing T cells (CD3+CLA+, yellow). A higher magnification of the same field is also shown. (C) Intracellular cytokine analysis of CD4+ T cells from two SCC tumors demonstrated a Th1 bias with few Th2 or Th17 T cells present. Unstimulated cells produced no detectable cytokines (not depicted). (D) Analysis of T cells from SCCs by flow cytometry for TCR Vβ expression demonstrated significant TCR diversity. Analysis of two additional tumors showed comparable diversity. Bars, 100 μm.
Figure 2.
Figure 2.
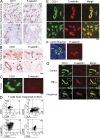
Blood vessels in areas of invasive SCCs do not express E-selectin, but imiquimod treatment induces vascular E-selectin expression and normalization of T cell homing. (A) Serial sections of SCCs demonstrated the presence of CD31+ blood vessels in areas of invasive SCCs, but these vessels lack E-selectin expression. (B) A second example is shown, in which tumor and peritumoral areas were present in a single stained section. (C) Immunofluorescence studies on a third sample stained for CD31 (green) and E-selectin (red), showing no E-selectin expression on tumor vessels. (D) SCCs treated with imiquimod before excision were heavily infiltrated with CLA+ (skin-homing) cytotoxic T cells. (E) A subset of tumor vessels in imiquimod-treated SCCs expressed E-selectin. (F) A second sample showing E-selectin expression on a subset of vessels embedded within a tumor nodule after imiquimod treatment. Large atypical keratinocytes forming a tumor nodule are demonstrated by Hoechst stain (blue). (G) In vitro treatment of SCC tumor tissue with imiquimod up-regulated E-selectin on a subset of tumor vessels. 2-mm bread loaf sections of untreated SCC tumor were incubated for 24 h in control medium, TNF-α, or imiquimod. Samples were then frozen, sectioned, and stained for CD31 and E-selectin. In all studies, Hoechst nuclear stain was used to identify areas of invasive tumor. Bars: (B, C, E, and F) 100 μm.
Figure 3.
Figure 3.
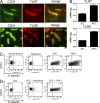
Imiquimod up-regulates E-selectin on endothelial cells by an indirect mechanism. (A) Immunofluorescence studies on frozen sections of SCC tumor stained for the vascular marker CD31 (green) and TLR7 or TLR8 (red). (B) Confirmation of TLR7 and TLR8 expression by real-time quantitative PCR. Cultured dermal microvascular endothelial cells were analyzed for TLR7 and TLR8 expression and compared with T cell–depleted peripheral blood mononuclear cells (APCs). (C) Imiquimod does not directly induce E-selectin on endothelial cells. Purified human endothelial cells were cultured with imiquimod or activated APC for 3 d or TNF-α for 12 h, and then harvested and assayed by flow cytometry for the expression of CD31 and E-selectin. Experiments using two additional endothelial cell donors produced similar results. (D) SCC tumor cells do not suppress baseline or induced E-selectin expression on endothelial cells. SCC13 tumor cells were co-cultured with endothelial cells in control medium (SCC), with imiquimod (SCC+imiquimod) or with TNF-α (SCC+TNF-α). No changes in basal or induced levels of endothelial E-selectin were observed. Experiments using two additional endothelial donors produced similar results. Bar, 100 μm.
Figure 4.
Figure 4.
SCCs are heavily infiltrated by FOXP3+ T reg cells recruited from blood. (A) T cells isolated from SCCs developing in normal individuals and transplant recipients contained many CD25hiFOXP3+ T reg cells. (B) T reg cells isolated from SCCs were CD4+ central memory T cells (L-selectin/CCR7+) and were distinct from cutaneous T reg cells found in normal skin as shown by their lack of expression of key skin-homing addressins (CLA, CCR4). The last two graphs are gated to show only CD3+FOXP3+ T cells. (C) Direct study of FOXP3+ T reg cells in areas of invasive SCCs using immunofluorescence staining of frozen sections. SCCs were stained for CD3 (red) and FOXP3 (green). Two FOXP3+ T reg cells are shown at the top of the left image, and a FOXP3 nonregulatory T cell is shown on the bottom. A larger field is shown in the right image. (D) A lower magnification image of another SCC, demonstrating that large numbers of FOXP3+ T reg cells (red cells with green nuclei) surround nodules of invasive tumor, which appear as pools of green secondary to nonspecific staining of tumor keratin. (E) Enumeration of T reg cells in frozen sections of SCCs. The number of T reg cells and nonregulatory T cells were counted in 10 high power (40X) fields in SCCs from normal patients (Immunocompetent) and transplant recipients (Transplant rcp) and the results were compared with that of normal skin. Shown are the mean and SD of counts from 10 fields. (F) FOXP3+ T reg cells are not locally expanded within SCCs. SCC sections were costained for FOXP3 and Ki-67, a marker of cell proliferation. Proliferative and nonproliferative FOXP3+ T reg cells were counted in 5 hpf for each donor; the mean and SD for each tumor are shown. SCC9 and 10 are from immunocompetent individuals; SCC11 is from a transplant recipient. Bars: (C, left) 10 μm; (C, right, and D) 100 μm.
Figure 5.
Figure 5.
Imiquimod-treated SCCs contain decreased percentages of FOXP3+ T reg cells and imiquimod treatment in vitro blocks the ability of T reg cells to suppress. (A) T cells isolated from imiquimod-treated SCCs contain few detectable FOXP3+ T reg cells. (B) Direct enumeration of FOXP3+ T reg cells in sections of imiquimod-treated SCCs (tx). Counts from untreated SCCs (untx) are shown for comparison. Mean and SD are shown. (C) Percentage of FOXP3 T reg cells infiltrating normal human skin (nml), untreated SCC tumors (untx, triangles; SCCs from healthy individuals, circles; SCCs from transplant recipients) and imiquimod-treated SCCs (tx). Bars indicate the SD of the percentage of T reg cells from 10 hpf. (D) Imiquimod does not affect the viability of nonregulatory T cells (FOXP3) and FOXP3+ T reg cells (FOXP3+) isolated from human skin. Viability was assessed after 1 wk of incubation in either control medium or imiquimod. (E) Imiquimod only slightly inhibits the proliferation of skin-derived T reg cells. T cells from human skin were labeled with CFSE and cultured with dermal fibroblasts and IL-15 for 1 wk in the presence or absence of imiquimod. Cells were then stained for FOXP3 expression. FOXP3+ T reg cells that have proliferated are shown in the top left quadrant of each histogram. (F) Imiquimod treatment paralyzes regulatory T cell function. T cells isolated from human skin were cultured for three days in control medium (untx, gray bars) or imiquimod (tx, black bars), and then separated into T reg cells, enriched CD25hi T cells (CD25hi), and responder CD25lo T cells (CD25lo). Cells were stimulated with soluble anti-CD3 and −CD28 and proliferation was assayed by incorporation of [3H]thymidine. Untreated CD25hi suppressed CD25lo T cell proliferation, but pretreatment of CD25hi cells with imiquimod blocked suppression. Suppression of imiquimod-treated CD25lo was restored by adding untreated CD25hi T cells, demonstrating that the suppressive defect was is the CD25hi subset. (G) At least three days of imiquimod pretreatment is required for loss of suppressive function. Skin T cells were cultured in control medium (squares) or imiquimod (circles) for the indicated length of time, and then cells were sorted and analyzed for suppressive ability. Bars indicate the SD of experiments from two different skin donors.
Figure 6.
Figure 6.
Imiquimod induces IL-6 production by effector T cells and reduces FOXP3 and production of IL-10 and TGF-β by T reg cells. (A) Imiquimod treatment induces IL-6 production by T cells in vitro and in vivo. Imiquimod or control medium was added to explant cultures of normal human skin for 1 wk. T cells were then isolated from these cultures and examined for IL-6 production. Imiquimod treatment of purified skin T cells alone had no effect. T cells were isolated from SCCs that were either untreated (SCC16) or treated in vivo with topical imiquimod (SCC8, 17, 18) and analyzed for IL-6 production. Histograms of SCC T cells are gated to show only CD3+ T cells. (B) IL-6 production from multiple donors after in vitro (skin T cells) or in vivo (SCC; 8, 17, 18) treatment with imiquimod. (C) FOXP3 expression as assayed by mean fluorescence intensity (MFI) under identical staining conditions in T cells from normal skin explant cultures (NS) treated for 1 wk with control medium (triangle) or imiquimod (circle, mean and SD of three determinations are shown) or from untreated SCCs (16; triangle) or SCCs treated in vivo with imiquimod (circles; 8, 16, 18). (D) IL-10 and TGF-β production as determined by intracellular cytokine analysis of FOXP3+ T reg cells isolated from untreated (SCC16) or imiquimod treated SCCs (SCC17). (E) IL-10 and TGF-β production by FOXP3+ T reg cells isolated from normal skin explant cultures (NS) treated for 1 wk with control medium (white bars) or imiquimod (black bars) and by FOXP3+ T reg cells isolated from untreated SCCs (16) or SCCs treated in vivo with imiquimod (8, 17, 18).
Figure 7.
Figure 7.
SCCs contain immature and iNOS+ DCs. Cryosections of untreated and imiquimod-treated SCCs were immunostained for the DC marker CD11c and markers of DC maturation CD83 (A) and DC-LAMP (B). Numerous immature DCs were present in untreated SCCs, whereas treated SCCs contained significant numbers of mature DC. Untreated SCCs also contained a population of cells that expressed high levels of iNOS (C, indicated by arrow), but these cells were not detected in imiquimod-treated SCCs. There was also some staining of tumor cells (T) in both untreated and treated tumors. A concentration-matched isotype control for iNOS staining is shown in the first image. Bars, 100 μm.
Figure 8.
Figure 8.
Imiquimod treated tumors contain expanded populations of TCR-biased cytotoxic T cells. T cells were isolated from untreated and imiquimod-treated SCCs and analyzed for Vβ expression by flow cytometry. Data are presented as the absolute number of CD8+ T cells of each Vβ family in 100 hpf. Imiquimod-treated tumors contained larger numbers of cytotoxic T cells, and these T cells had clearly biased Vβ repertoires, consistent with local expansion of tumor-specific T cells.

Similar articles

Cited by

References

    1. Diepgen, T.L., and V. Mahler. 2002. The epidemiology of skin cancer. Br. J. Dermatol. 146:1–6. - PubMed
    1. Housman, T.S., S.R. Feldman, P.M. Williford, A.B. Fleischer Jr., N.D. Goldman, J.M. Acostamadiedo, and G.J. Chen. 2003. Skin cancer is among the most costly of all cancers to treat for the Medicare population. J. Am. Acad. Dermatol. 48:425–429. - PubMed
    1. Feldman, S.R., A.B. Fleischer Jr., and R.C. McConnell. 1998. Most common dermatologic problems identified by internists, 1990-1994. Arch. Intern. Med. 158:726–730. - PubMed
    1. Warino, L., M. Tusa, F. Camacho, H. Teuschler, A.B. Fleischer Jr., and S.R. Feldman. 2006. Frequency and cost of actinic keratosis treatment. Dermatol. Surg. 32:1045–1049. - PubMed
    1. Berg, D., and C.C. Otley. 2002. Skin cancer in organ transplant recipients: epidemiology, pathogenesis, and management. J. Am. Acad. Dermatol. 47:1–17. - PubMed

Publication types

MeSH terms