. 2008 Sep 11;59(5):746-58.
doi: 10.1016/j.neuron.2008.07.032.

p75(NTR) mediates ephrin-A reverse signaling required for axon repulsion and mapping

Affiliations

p75(NTR) mediates ephrin-A reverse signaling required for axon repulsion and mapping

Yoo-Shick Lim et al. Neuron. .

Abstract

Reverse signaling by ephrin-As upon binding EphAs controls axon guidance and mapping. Ephrin-As are GPI-anchored to the membrane, requiring that they complex with transmembrane proteins that transduce their signals. We show that the p75 neurotrophin receptor (NTR) serves this role in retinal axons. p75(NTR) and ephrin-A colocalize within caveolae along retinal axons and form a complex required for Fyn phosphorylation upon binding EphAs, activating a signaling pathway leading to cytoskeletal changes. In vitro, retinal axon repulsion to EphAs by ephrin-A reverse signaling requires p75(NTR), but repulsion to ephrin-As by EphA forward signaling does not. Constitutive and retina-specific p75(NTR) knockout mice have aberrant anterior shifts in retinal axon terminations in superior colliculus, consistent with diminished repellent activity mediated by graded ephrin-A reverse signaling induced by graded collicular EphAs. We conclude that p75(NTR) is a signaling partner for ephrin-As and the ephrin-A- p75(NTR) complex reverse signals to mediate axon repulsion required for guidance and mapping.


Figures
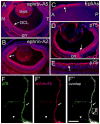
Figure 1
Figure 1. Retinal Expression and Co-localization of p75 and Ephrin-As
(A to E) Cryosections at 20μm of P2 wild type mouse stained with DAPI to label nuclei (blue). (A and B) Retina immunolabeled with (A) anti-ephrin-A5 (red) and (B) anti-ephrin-A2 (red). Ephrin-A5 and ephrin-A2 are present in the ganglion cell layer (GCL; arrows), retinal ganglion cells (RGCs), RGC axons, and the optic nerve (on). Ephrin-A5 and ephrin-A2 are present in a high to low nasal (N) - temporal (T) gradient. (C) Sagittal section through superior colliculus (SC) labeled with ephrin-A5-Fc affinity probe. EphAs are in a high to low anterior (A) to posterior (P) gradient in superficial layers of SC (arrow; red). (D and E) Retina immunolabeled with anti-p75 shown at low (D) and high (E) magnification. p75 (red) is present throughout retina, including the GCL, RGC axons (arrows), and optic nerve. (F to F) Mouse retinal axon in vitro double-labeled with (F) anti-p75 and (F) anti-ephrin-A5. Discrete domains of p75 and ephrin-A5 on the cell body (asterisks) and its processes are evident. (F) Overlap of p75 (green) and ephrin-A5 (red) labeling demonstrates their co-localization (yellow; arrows), though clear domains of each are visible (arrowhead). Co-localized domains are in close proximity to domains of p75 and ephrin-A5 (inset). Scale bar=50μm in A to D, 15μm in E, 8μm in F-F″.
Figure 2
Figure 2. Ephrin-As and p75 are Present in the Same Complex
(A) Retina from wild type and p75 null mutant mice immunoprecipitated (IP) with anti-p75 antibody (Buster) or anti-ephrin-A2 antibody (R&D systems). Western blots (WB) reveal that p75 and ephrin-A2 co-IP. (B) PC12 cells and PC12 cells stably transfected with V5-ephrin-A2 immunoprecipitated with the antibody indicated. Western blots demonstrate that p75 (endogenously expressed by PC12 cells) and V5-ephrin-A2 co-IP. (C) Triple immunolabeled 293 cells transfected with V5-ephrin-A2 or cMyc-p75. Cells were incubated with EphA7-Fc and triple-labeled with antibodies against cMyc, V5, and Fc. Both p75 (red, arrowhead) and ephrin-A2 (blue) are in a punctate distribution on distinct cells. EphA7-Fc (green, arrow) labels only cells transfected with V5-ephrin-A2. Cells are also stained with DAPI (white; nuclei). Western blots after IPs with the antibodies listed on 293T cells transiently transfected with the construct(s) indicated (+) demonstrate that ephrin-A2 and ephrin-A5 co-IP with p75.
Figure 3
Figure 3. EphA-Induced Fyn Phosphorylation in Caveolae Requires p75
(A to C) Stably transfected V5-ephrin-A2, p75 and V5-ephrinA2/p75 293 cells treated with Human-Fc (2 μg/ml) or EphA7-Fc (2 μg/ml) for 10 minutes at 37°C. Cells were lysed and fractionated through a sucrose gradient (see Experimental Procedures). The presence of the caveolae (cav) associated protein flotillin-1, detected with an anti-flotillin-1 antibody, and GM1, detected with CTX-HRP in a dot blot, indicates the fractions containing caveolae. Tyrosine phosphorylation (p-Tyr; 4G10 antibody) in the caveolae fractions is unchanged when challenged with EphA7-Fc compared to Fc in both the (A) ephrin-A2 cell line and the (B) p75 cell line. (C) In contrast, the ephrin-A2/p75 cell line has a higher level of p-Tyr in caveolae fractions (arrowheads) when treated with EphA7-Fc compared to Fc alone (arrows). The largest increase in p-Tyr (arrowheads) is coincident with the location of Fyn on the re-probed blot (hollow arrowheads).
Figure 4
Figure 4. Retinal Axons Require p75 for EphA7 Repulsion
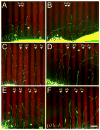
(A to D) In vitro protein stripe assays demonstrating that wild type RGC axons preferentially avoid stripes containing EphA7 but p75 −/− RGC axons do not. (A and B) Axons (green) extending on a control substrate of alternating stripes of human-Fc and human-Fc (Fc). Axons do not show a growth preference for one stripe over the other whether they extend from (A) a p75 +/+ mouse retinal explant or from (B) a p75 −/− retinal explant. (C and D) Axons extending on a substrate of alternating stripes of human-Fc and EphA7-Fc (red; A7). (C) Axons from a p75 +/+ retinal explant preferentially extend on the human-Fc stripes and avoid the EphA7 stripes. (D) In contrast, axons from a p75 −/− retinal explant do not avoid stripes containing EphA7. (E and F) Axons extending on a substrate of alternating stripes of human-Fc and ephrin-A5-Fc (red; A5). Axons show a strong preference for the Fc containing stripes and avoid the ephrin-A5 containing stripes whether they extend from (E) a p75 +/+ retinal explant or from (F) a p75 −/− retinal explant. Scale bar=200μm.
Figure 5
Figure 5. Statistical Analysis of Stripe Assay Results
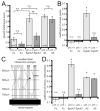
(A) Average growth preference scores (error bars=s.e.m.) for retinal axons in the stripe assay (see Experimental Procedures). A score of four is an essentially complete choice for one stripe, a score of zero is no discernible choice for either stripe. Retinal axons do not show a preference on control human-Fc vs human-Fc (Fc) substrates. Retinal axons from p75 +/+ explants show significant avoidance of EphA7 compared to retinal axons from p75 −/− explants. In contrast, axons extending from p75 +/+ or p75 −/− explants avoid ephrin-A5 (A5) to a similar extent. (B) The coefficient of choice for p75 +/+ and p75 −/− axons extending on control Fc vs Fc substrates or EphA7-Fc vs Fc substrates is shown. Pixels representing axons present in each stripe were quantified and the coefficient calculated as the number of pixels on the Fc stripe minus pixels on the second stripe (Fc or EphA7), divided by total pixels (see Experimental Procedures). A coefficient of one is an absolute choice for the control stripe and a coefficient of zero indicates no preference. p75 +/+ axons preferentially avoid EphA7 stripes, whereas p75 −/− axons do not show a significant preference for Fc stripes compared to EphA7 stripes. (C and D) Protein stripe assays analyzed with a simplified Sholl intersection analysis. (C) Schematic demonstrates the analysis method (see Experimental Procedures). All intersections (arrowheads) between axons and lines at defined distances from the explant edge were counted blind to genotype, stripe content, and stripe position. (D) Coefficients of choice for intersection points determined by the modified Sholl analysis (intersections on the Fc stripe minus intersections on the second stripe (Fc or EphA7 or ephrin-A5), divided by total intersections). On Fc vs Fc substrates there is no significant choice for either stripe. In contrast, p75 +/+ axons extending on Fc vs EphA7 substrates intersect the Sholl lines significantly more often on Fc stripes than on EphA7 stripes. However, in p75 −/− axons, this preference is greatly reduced and the number of intersection points on Fc and EphA7 stripes is not significantly different. For both p75 +/+ and p75 −/− axons extending on Fc vs ephrin-A5 substrates, significantly more intersection points occur on Fc stripes compared to ephrin-A5 stripes. N values in panel A apply to panels B and D. n.s., not significant; *, p<0.02; **, p<0.001.
Figure 6
Figure 6. Aberrant Retinocollicular Mapping in p75 Knockout Mice
(A) Dorsal view of the superior colliculus (SC) of a P8 wild type mouse after focal injection of DiI in nasal (N) retina reveals a dense termination zone (TZ) in posterior (P, dotted line is posterior SC border) SC. No interstitial branches are evident in the SC outside of the TZ at this age in p75 +/+ mice. Arrowheads mark the anterior (A) border. (B) SC of a P8 p75 −/− mouse injected with DiI in nasal retina (injection is similar in size and location to that in panel A), reveals a dense TZ in posterior SC, but shifted anteriorly (sTZ) in comparison to wild type. Multiple branches (arrows) and rudimentary arbors (black arrowhead) are evident throughout the SC, anterior to the TZ. (C) Schematic describing the expression of cre-recombinase in nasal and temporal retinal ganglion cells (RGCs; red) in α-cre mice. The α-cre line in combination with the ROSA-GAP43-eGFP (R-eGFP) line results in a stereotypic pattern of eGFP labeled RGC axons (green) in three distinct domains in the SC, corresponding to the eGFP-labeled projection from temporal (Td) and nasal (Nd) retina, and the unlabeled central domain (Cd). (D) Dorsal view of the SC of a p75 +/+; α-cre; R-eGFP mouse illustrating the stereotypic pattern of R-eGFP in wild type mice. Bracket denotes the anterior-posterior extent of the Nd. (E and F) RGC projections in p75 −/−; α-cre; R-eGFP mice show an anterior shift in nasal RGC axon mapping. (E) Bracket denotes an extended, anteriorly shifted Nd. (F) In some p75 −/− cases the eGFP is discontinuous and has gaps (arrow) indicating a disorganized projection. These gaps are not observed in p75 +/+; α-cre; R-eGFP mice. L, lateral; M, medial. Scale bar=400μm.
Figure 7
Figure 7. Conditional Allele of p75 is Excised with Cre Recombinase
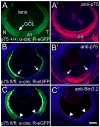
(A and A) Cryosection through a P2 p75 +/+; α-cre; R-eGFP mouse. The nasal (N) and temporal (T) aspects of the retina, including the ganglion cell layer (GCL), are labeled with eGFP, mimicking cre expression. The distribution of p75 is unaffected in p75 +/+; α-cre; R-eGFP mice. (B and B) However, in p75 fl/fl; α-cre; R-eGFP mice, p75 protein is not detectable at P2 in nasal and temporal retina, but unchanged in central retina. The eGFP label in panel B indicates the presence of cre-recombinase and, thus, the cells in which p75 has been excised. The arrows are in the same position and denote the border of eGFP expression. (C and C) Cryosection from the retina of a p75 fl/fl; α-cre; R-eGFP mouse labeled for the RGC marker Brn3.2 at P2. The proportion of RGCs in central retina, where p75 expression is unaltered, is identical to that in nasal and temporal retina, where p75 is absent. Arrowheads denote the edges of cre expression. Scale bar=40μm.
Figure 8
Figure 8. Aberrant Retinocollicular Mapping in p75 Conditional Mice
(A) Dorsal view of the superior colliculus (SC) of p75 fl/fl; cre-negative mouse at P8 after focal injection of DiI in nasal retina reveals a dense termination zone (TZ) in posterior (P) SC (dotted line is posterior SC border; arrowheads mark the anterior (A) SC border). (B and C) SCs of p75 fl/fl; α-cre mice at P8 after focal injections of DiI in nasal retina, similar in size and location to that in panel A. (B) In every p75 fl/fl; α-cre case the TZ is shifted (sTZ) anteriorly, compared to its expected position. (C) In a subset of p75 fl/fl; α-cre mice focal DiI injection reveals two TZs in posterior SC. The arrow points to the appropriate location of the TZ, with a sTZ in an anterior position. (D) A p75 +/+; α-cre; R-eGFP case illustrates the stereotypic pattern of the eGFP labeled temporal and nasal RGC axon projection domains (Td and Nd respectively). The projection domain from central retina (Cd) is unlabeled. (E and F) In p75 fl/fl; α-cre; R-eGFP mice, the Nd of is significantly expanded anteriorly and the Cd is significantly reduced. In many p75 fl/fl; α-cre; R-eGFP cases the eGFP is discontinuous and has a mottled appearance, suggesting a disorganized map (arrow in E). L, lateral; M, medial. Scale bar=400μm.
Figure 9
Figure 9. Quantification of Retinocollicular Shifts in p75 Mutant Mice
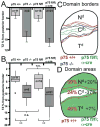
(A) Average position of the center of the DiI-labeled termination zones (TZs) from the posterior pole of the superior colliculus (SC) in percent of the anterior-posterior (AP) extent of the SC. There is a significant anterior shift in TZ position for p75 −/− and p75 fl/fl; α-cre mice compared to controls. The positions of retinal injection sites between genotypes are not statistically distinct. (B) Box plots illustrating the distributions of TZ locations. The top and bottom edges of each box are the 25th and 75th percentile, respectively. The horizontal line within each box is the median value. The vertical ‘whiskers’ extend above and below each box to the most divergent point within three times the interquartile value. Filled circles are outliers. The distribution of TZ positions for p75 +/+ and p75 fl/fl; cre negative are not different. However, p75 −/− and p75 fl/fl; α-cre mice have TZ distributions significantly shifted anteriorly. Mann-Whitney U-test p-values for the pairs indicated: n.s., not significant; *, p<0.01; **, p<0.001. (C) Borders of R-eGFP labeling superimposed on a dorsal view of the SC for the p75 +/+; α-cre; R-eGFP cases in Figures 6D and 8D (red). Two representative p75 −/−; α-cre; R-eGFP cases (blue; from Figures 6E and 6F) illustrate the anterior shift of the nasal domain (Nd). The p75 fl/fl; α-cre; R-eGFP case shown in Figure 8E is illustrated in green. Note the large anterior shift of the Nd and a reduced central domain (Cd). (D) Average projection domain areas superimposed on a dorsal view of the SC. The lines indicate the average AP positions for borders of eGFP labeling for p75 +/+; α-cre; R-eGFP mice (red) and p75 fl/fl; α-cre; R-eGFP mice (green). The values for p75 +/+ cases (red) indicate the area of the SC each domain occupies, whereas the values for p75 fl/fl; α-cre cases (green) represent the percentage change from wild type. There is a significant expansion and anterior shift of the Nd (p < 0.01) and a concomitant significant decrease in the Cd in p75 fl/fl; α-cre mice compared to control mice (p < 0.01).

Similar articles

Cited by

References

    1. Alsina B, Vu T, Cohen-Cory S. Visualizing synapse formation in arborizing optic axons in vivo: dynamics and modulation by BDNF. Nature Neurosci. 2001;4:1093–1101. - PubMed
    1. Barker PA. p75NTR is positively promiscuous: novel partners and new insights. Neuron. 2004;42:529–533. - PubMed
    1. Baumer N, Marquardt T, Stoykova A, Ashery-Padan R, Chowdhury K, Gruss P. Pax6 is required for establishing naso-temporal and dorsal characteristics of the optic vesicle. Development. 2002;129:4535–4545. - PubMed
    1. Ben-Zvi A, Ben-Gigi L, Klein H, Behar O. Modulation of Semaphorin3A activity by p75 neurotrophin receptor influences peripheral axon patterning. J Neurosci. 2007;27:13000–13011. - PMC - PubMed
    1. Brown A, Yates PA, Burrola P, Ortuño D, Vaidya A, Jessell TM, Pfaff SL, O’Leary DDM, Lemke G. Topographic mapping from the retina to the midbrain is controlled by relative but not absolute levels of EphA receptor signaling. Cell. 2000;7:77–88. - PubMed

Publication types

MeSH terms

LinkOut - more resources