Single sample extraction protocol for the quantification of NAD and NADH redox states in Saccharomyces cerevisiae
- PMID: 18763242
- PMCID: PMC2640230
- DOI: 10.1002/jssc.200800238
Single sample extraction protocol for the quantification of NAD and NADH redox states in Saccharomyces cerevisiae
Abstract
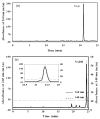
A robust redox extraction protocol for quantitative and reproducible metabolite isolation and recovery has been developed for simultaneous measurement of nicotinamide adenine dinucleotide (NAD) and its reduced form, NADH, from Saccharomyces cerevisiae. Following culture in liquid media, yeast cells were harvested by centrifugation and then lysed under nonoxidizing conditions by bead blasting in ice-cold, nitrogen-saturated 50 mM ammonium acetate. To enable protein denaturation, ice cold nitrogen-saturated CH(3)CN/50 mM ammonium acetate (3:1 v/v) was added to the cell lysates. Chloroform extractions were performed on supernatants to remove organic solvent. Samples were lyophilized and resuspended in 50 mM ammonium acetate. NAD and NADH were separated by HPLC and quantified using UV-Vis absorbance detection. NAD and NADH levels were evaluated in yeast grown under normal (2% glucose) and calorie restricted (0.5% glucose) conditions. Results demonstrate that it is possible to perform a single preparation to reliably and robustly quantitate both NAD and NADH contents in the same sample. Robustness of the protocol suggests it will be (i) applicable to quantification of these metabolites in other cell cultures; and (ii) amenable to isotope labeling strategies to determine the relative contribution of specific metabolic pathways to total NAD and NADH levels in cell cultures.
Conflict of interest statement
The authors declared no conflict of interest.
Figures


Similar articles
-
Single-sample preparation for simultaneous cellular redox and energy state determination.Anal Biochem. 2003 Nov 1;322(1):51-9. doi: 10.1016/j.ab.2003.07.013. Anal Biochem. 2003. PMID: 14705780
-
Determination of the in vivo NAD:NADH ratio in Saccharomyces cerevisiae under anaerobic conditions, using alcohol dehydrogenase as sensor reaction.Yeast. 2015 Aug;32(8):541-57. doi: 10.1002/yea.3078. Epub 2015 Jul 14. Yeast. 2015. PMID: 26059529
-
Extraction and Quantitation of Nicotinamide Adenine Dinucleotide Redox Cofactors.Antioxid Redox Signal. 2018 Jan 20;28(3):167-179. doi: 10.1089/ars.2017.7014. Epub 2017 Jul 19. Antioxid Redox Signal. 2018. PMID: 28497978 Free PMC article.
-
Stoichiometry and compartmentation of NADH metabolism in Saccharomyces cerevisiae.FEMS Microbiol Rev. 2001 Jan;25(1):15-37. doi: 10.1111/j.1574-6976.2001.tb00570.x. FEMS Microbiol Rev. 2001. PMID: 11152939 Review.
-
Organization and regulation of the cytosolic NADH metabolism in the yeast Saccharomyces cerevisiae.Mol Cell Biochem. 2004 Jan-Feb;256-257(1-2):73-81. doi: 10.1023/b:mcbi.0000009888.79484.fd. Mol Cell Biochem. 2004. PMID: 14977171 Review.
Cited by
-
A yeast metabolite extraction protocol optimised for time-series analyses.PLoS One. 2012;7(8):e44283. doi: 10.1371/journal.pone.0044283. Epub 2012 Aug 29. PLoS One. 2012. PMID: 22952947 Free PMC article.
-
Activation of protein kinase C-mitogen-activated protein kinase signaling in response to inositol starvation triggers Sir2p-dependent telomeric silencing in yeast.J Biol Chem. 2013 Sep 27;288(39):27861-71. doi: 10.1074/jbc.M113.493072. Epub 2013 Aug 13. J Biol Chem. 2013. PMID: 23943620 Free PMC article.
-
Sex-related differences in human plasma NAD+/NADH levels depend on age.Biosci Rep. 2021 Jan 29;41(1):BSR20200340. doi: 10.1042/BSR20200340. Biosci Rep. 2021. PMID: 33393613 Free PMC article.
-
Two functionally distinct NADP+-dependent ferredoxin oxidoreductases maintain the primary redox balance of Pyrococcus furiosus.J Biol Chem. 2017 Sep 1;292(35):14603-14616. doi: 10.1074/jbc.M117.794172. Epub 2017 Jul 13. J Biol Chem. 2017. PMID: 28705933 Free PMC article.
-
"NAD-capQ" detection and quantitation of NAD caps.RNA. 2018 Oct;24(10):1418-1425. doi: 10.1261/rna.067686.118. Epub 2018 Jul 25. RNA. 2018. PMID: 30045887 Free PMC article.
References
-
- Smith JS, Boeke JD. Genes Dev. 1997;11:241–254. - PubMed
-
- Anderson RM, Bitterman KJ, Wood JG, Medvedik O, Cohen H, Lin SS, Manchester JK, Gordon JI, Sinclair DA. J Biol Chem. 2002;277:18881–18890. - PubMed
-
- Lin SJ, Defossez PA, Guarente L. Science. 2000;289:2126–2128. - PubMed
-
- Lin SJ, Kaeberlein M, Andalis AA, Sturtz LA, Defossez PA, Culotta VC, Fink GR, Guarente L. Nature. 2002;418:344–348. - PubMed
Publication types
MeSH terms
Substances
Grants and funding
- P41 RR013461-040001/RR/NCRR NIH HHS/United States
- P41 RR013461-02/RR/NCRR NIH HHS/United States
- P41 RR013461-03/RR/NCRR NIH HHS/United States
- P41 RR013461/RR/NCRR NIH HHS/United States
- P41 RR013461-069001/RR/NCRR NIH HHS/United States
- P41 RR013461-05/RR/NCRR NIH HHS/United States
- P41 GM103483/GM/NIGMS NIH HHS/United States
- P41 RR013461-01A1/RR/NCRR NIH HHS/United States
- P41 RR013461-09/RR/NCRR NIH HHS/United States
- P41 RR013461-08/RR/NCRR NIH HHS/United States
- P41 RR013461-07/RR/NCRR NIH HHS/United States
- P41 RR013461-04/RR/NCRR NIH HHS/United States
- P41 RR013461-10/RR/NCRR NIH HHS/United States
- P41RR013461/RR/NCRR NIH HHS/United States
- P41 RR013461-06/RR/NCRR NIH HHS/United States
LinkOut - more resources
Full Text Sources
Other Literature Sources
Molecular Biology Databases

