. 2008 Nov;295(5):H1882-94.
doi: 10.1152/ajpheart.412.2008. Epub 2008 Aug 29.

Endothelial function and vascular oxidative stress in long-lived GH/IGF-deficient Ames dwarf mice

Affiliations

Endothelial function and vascular oxidative stress in long-lived GH/IGF-deficient Ames dwarf mice

Anna Csiszar et al. Am J Physiol Heart Circ Physiol. 2008 Nov.

Abstract

Hypopituitary Ames dwarf mice have low circulating growth hormone (GH)/IGF-I levels, and they have extended longevity and exhibit many symptoms of delayed aging. To elucidate the vascular consequences of Ames dwarfism we compared endothelial O2(-) and H2O2 production, mitochondrial reactive oxygen species (ROS) generation, expression of antioxidant enzymes, and nitric oxide (NO) production in aortas of Ames dwarf and wild-type control mice. In Ames dwarf aortas endothelial O2(-) and H2O2 production and ROS generation by mitochondria were enhanced compared with those in vessels of wild-type mice. In Ames dwarf aortas there was a less abundant expression of Mn-SOD, Cu,Zn-SOD, glutathione peroxidase (GPx)-1, and endothelial nitric oxide synthase (eNOS). NO production and acetylcholine-induced relaxation were also decreased in aortas of Ames dwarf mice. In cultured wild-type mouse aortas and in human coronary arterial endothelial cells treatment with GH and IGF significantly reduced cellular O2(-) and H2O2 production and ROS generation by mitochondria and upregulated expression of Mn-SOD, Cu,Zn-SOD, GPx-1, and eNOS. Thus GH and IGF-I promote antioxidant phenotypic changes in the endothelial cells, whereas Ames dwarfism leads to vascular oxidative stress.


Figures
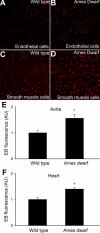
Fig. 1.
Fig. 1.
Representative confocal images showing ethidium bromide staining (EB, red fluorescence) in endothelial (A and B) and smooth muscle cells (C and D) of aortas from Ames dwarf mice (B and D) and wild-type controls after dihydroethidine (DHE) treatment (A and C; original magnification: ×40). E and F: results from DHE staining experiments. Time course of buildup of EB fluorescence in aortic segments (E) and cardiac muscle preparations (F) of the mice was obtained. Bar graphs are summary data for slope factors normalized to cell number (i.e., nuclear DNA content, assessed by Hoechst fluorescence intensity), representing tissue O2•− production. Data are means ± SE (n = 5 animals in each group). *P < 0.05. Arbitrary units (AU): ΔEB fluorescence/dt/DNA content.
Fig. 2.
Fig. 2.
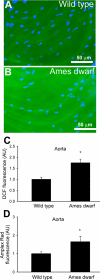
A and B: representative fluorescent images showing H2O2 production (measured by the C-H2DCFDA fluorescence method) in endothelial cells of en face preparations of aortas of wild-type (A) and Ames dwarf (B) mice. Green fluorescence, dichlorofluorescein (DCF); blue fluorescence, Hoechst-stained endothelial nuclei (original magnification ×10). C: time course of buildup of DCF fluorescence in aortic segments of the mice was obtained. Bar graphs are summary data for slope factors normalized to cell number (i.e., nuclear DNA content, assessed by Hoechst fluorescence intensity), representing tissue H2O2 production. Bar graphs are summary data of DCF fluorescent intensities in endothelial cells of Ames dwarf mice and wild-type control mice (means ± SE, n = 5 animals for each group; *P < 0.05). AU, ΔDCF fluorescence/dt/DNA content. D: results from Amplex red-horseradish peroxidase assays. Time course of buildup of Amplex red fluorescence by aortic segments of Ames dwarf mice showed a significantly steeper slope than those of wild-type controls. Data are means ± SE. n = 5 animals for each group. *P < 0.05.
Fig. 3.
Fig. 3.
Treatment of human coronary arterial endothelial cells (HCAECs) with growth hormone (GH) and IGF-I (for 24 h) attenuates cellular reactive oxygen species (ROS) production. A–C: representative fluorescent images showing GH- and IGF-I-treated HCAECs [left: phase contrast image; center: red fluorescent EB staining; right: green H2DCFDA (DCF) fluorescence]. D–G: bar graphs are summary data of EB (D and F) and DCF (E and G) fluorescent intensities in GH- and IGF-I treated HCAECs (D and E) and neonatal rat cardiac myocytes (F and G). Data are means ± SE. *P < 0.05.
Fig. 4.
Fig. 4.
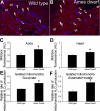
A and B: representative confocal images showing stronger perinuclear MitoSox staining (red fluorescence) in Ames dwarf mouse aorta (arrows, endothelial cells; arrowheads, smooth muscle cells; el, internal elastic lamina) compared with wild-type control vessel. Hoechst 33258 (blue fluorescence) was used for nuclear staining (original magnification ×20). C and D: time course of buildup of MitoSox fluorescence in Ames dwarf mouse and wild-type control aortas (C) and cardiac muscles (D) was obtained. Bar graphs are summary data for the slope factor obtained from the time course experiments normalized to tissue mass, representing mitochondrial ROS production in the tissues. Data are means ± SE (n = 5 in each group). *P < 0.05. E and F: relative H2O2 production by heart mitochondria respiring on succinate (E) or glutamate + malate (F) as substrate. For details see methods. Hydrogen peroxide generation rates were determined fluorometrically. Data are means ± SE. *P < 0.05.
Fig. 5.
Fig. 5.
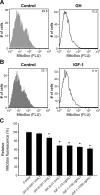
A and B: representative histograms of flow cytometry experiments demonstrating that GH (0.001 U/ml, A) and IGF-I (10 ng/ml, B) treatments elicit significant decrease in mean fluorescent intensity of oxidized MitoSox in HCAECs. Experiments were performed in quadruplicates with identical results. FLU, arbitrary fluorescence units. C: time course of buildup of MitoSox fluorescence in GH- and IGF-treated HCAECs was obtained. Bar graphs are summary data for the slope factor obtained from the time course experiments normalized to cell number (i.e., nuclear DNA content, assessed by Hoechst fluorescence intensity), representing mitochondrial O2•− generation. Data are means ± SE (n = 8 in each group). *P < 0.05.
Fig. 6.
Fig. 6.
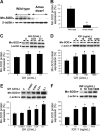
A: original Western blot showing expression of Mn-SOD in aortas of Ames dwarf mice and wild-type control mice. β-Actin content was used for normalization. B: bar graphs are densitometric data (means ± SE). *P < 0.05. C and D: in cultured aortic segments from wild-type mice, in vitro treatment with GH (C) and IGF (D) elicits dose-dependent upregulation of Mn-SOD (Western blotting). Bar graphs are densitometric data (means ± SE). *P < 0.05 vs. untreated. E and F: in HCAECs in vitro treatment with GH (E) and IGF (F) elicits dose-dependent upregulation of Mn-SOD (Western blotting). Bar graphs are densitometric data (means ± SE). *P < 0.05 vs. untreated.
Fig. 7.
Fig. 7.
A: original Western blot showing expression of Cu,Zn-SOD in aortas of Ames dwarf mice and wild-type control mice. β-Actin content was used for normalization. B: bar graphs are densitometric data (means ± SE). *P < 0.05. C and D: in cultured aortic segments from wild-type mice in vitro treatment with GH (C) and IGF (D) elicits dose-dependent upregulation of Cu,Zn-SOD (Western blotting). Bar graphs are densitometric data (means ± SE). *P < 0.05 vs. untreated. E and F: in HCAECs in vitro treatment with GH (C) and IGF (D) elicits dose-dependent upregulation of Cu,Zn-SOD (Western blotting). Bar graphs are densitometric data (means ± SE). *P < 0.05 vs. untreated.
Fig. 8.
Fig. 8.
A: original Western blot showing expression of glutathione peroxidase (GPx)-1 in aortas of Ames dwarf mice and wild-type control mice. β-Actin content was used for normalization. Bar graphs are densitometric data (means ± SE). *P < 0.05. B: in aortas of Ames dwarf mice mRNA expression of GPx-1 was significantly decreased. Analysis of mRNA expression was performed by real-time quantitative RT-PCR (QRT-PCR). β-Actin was used for normalization. Data are means ± SE (n = 5 for each group). *P < 0.05. C: in cultured aortic segments from wild-type mice in vitro treatment with Ames dwarf serum resulted in a marked downregulation of GPx-1 (Western blotting). Bar graphs are densitometric data (means ± SE). *P < 0.05. D: original Western blot showing expression of GPx-1 in aortas of GH-transgenic (GH-tg) mice and wild-type control mice. β-Actin content was used for normalization. Bar graphs are densitometric data (means ± SE). *P < 0.05. E and F: in cultured aortic segments from wild-type mice, in vitro treatment with GH (E) and IGF (F) elicits dose-dependent upregulation of GPx-1 (Western blotting). Bar graphs are densitometric data (means ± SE). *P < 0.05 vs. untreated. G and H: in HCAECs in vitro treatment with GH (G) and IGF (H) elicits dose-dependent upregulation of GPx-1 (Western blotting). Bar graphs are densitometric data (means ± SE). *P < 0.05 vs. untreated.
Fig. 9.
Fig. 9.
Original Western blot showing expression of catalase in aortas of Ames dwarf mice and wild-type control mice. β-Actin content was used for normalization. Bar graphs are densitometric data (means ± SE).
Fig. 10.
Fig. 10.
A: original Western blot showing expression of endothelial nitric oxide synthase (eNOS) in aortas of Ames dwarf mice and wild-type control mice. β-Actin content was used for normalization. Bar graphs are densitometric data (means ± SE). *P < 0.05. B: in aortas of Ames dwarf mice, mRNA expression of eNOS was significantly decreased. Analysis of mRNA expression was performed by real-time QRT-PCR. β-Actin was used for normalization. Data are means ± SE (n = 5 for each group). *P < 0.05. C: representative fluorescent images showing that in the endothelial cells of unstimulated Ames dwarf aortas diaminofluorescein fluorescence tended to be weaker than in those of wild-type mice (en face preparations). Hoechst 33258 (blue fluorescence) was used for nuclear staining. D: bar graphs are fluorescent intensity values (means ± SE). n.s., Not significant. E: acetylcholine-induced relaxation in vessels of Ames dwarf mice and wild-type mice (means ± SE). *P < 0.05. vs. wild type. Responses of Ames dwarf vessels in the presence of SOD are also shown (n.s. vs. wild type). F: acetylcholine-induced relaxation in vessels of GH-tg mice and wild-type mice (means ± SE, n.s.). G: vascular relaxations to the nitric oxide donor S-nitroso-N-acetyl-penicillamine (SNAP) (n.s.). H and I: in HCAECs, in vitro treatment with GH (H) and IGF (I) elicits dose-dependent upregulation of eNOS (Western blotting). Bar graphs are densitometric data (means ± SE). *P < 0.05 vs. untreated.

Similar articles

Cited by

References

    1. Al-Regaiey KA, Masternak MM, Bonkowski M, Sun L, Bartke A. Long-lived growth hormone receptor knockout mice: interaction of reduced insulin-like growth factor I/insulin signaling and caloric restriction. Endocrinology 146: 851–860, 2005. - PubMed
    1. Amador-Noguez D, Yagi K, Venable S, Darlington G. Gene expression profile of long-lived Ames dwarf mice and Little mice. Aging Cell 3: 423–441, 2004. - PubMed
    1. Bartke A, Brown-Borg H. Life extension in the dwarf mouse. Curr Top Dev Biol 63: 189–225, 2004. - PubMed
    1. Bartke A, Chandrashekar V, Bailey B, Zaczek D, Turyn D. Consequences of growth hormone (GH) overexpression and GH resistance. Neuropeptides 36: 201–208, 2002. - PubMed
    1. Boger RH, Skamira C, Bode-Boger SM, Brabant G, von zur Muhlen A, Frolich JC. Nitric oxide may mediate the hemodynamic effects of recombinant growth hormone in patients with acquired growth hormone deficiency. A double-blind, placebo-controlled study. J Clin Invest 98: 2706–2713, 1996. - PMC - PubMed

Publication types

MeSH terms