. 2008 Aug 22;4(8):e1000154.
doi: 10.1371/journal.pcbi.1000154.

A feature-based approach to modeling protein-DNA interactions

Affiliations

A feature-based approach to modeling protein-DNA interactions

Eilon Sharon et al. PLoS Comput Biol. .

Abstract

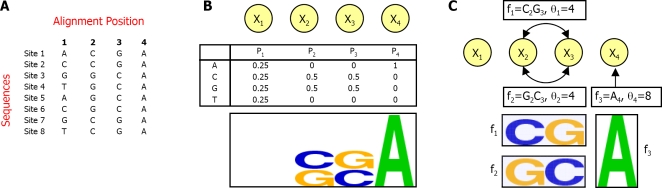
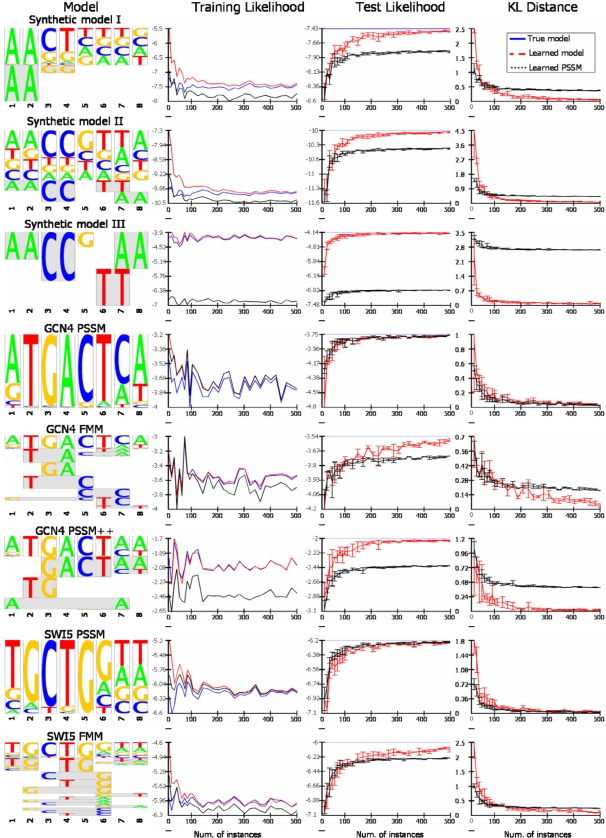
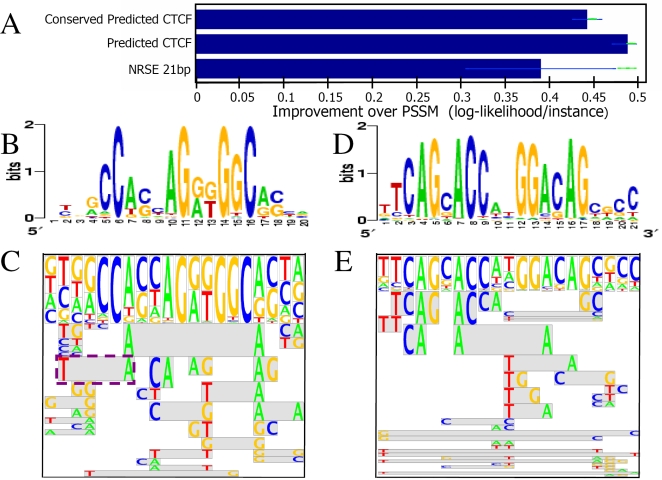
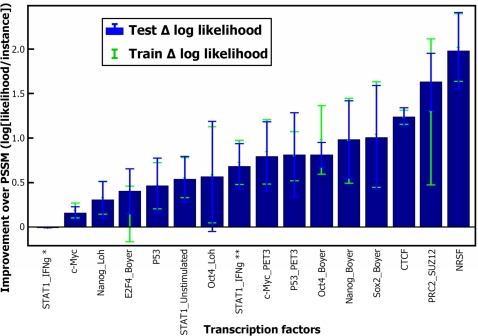
Transcription factor (TF) binding to its DNA target site is a fundamental regulatory interaction. The most common model used to represent TF binding specificities is a position specific scoring matrix (PSSM), which assumes independence between binding positions. However, in many cases, this simplifying assumption does not hold. Here, we present feature motif models (FMMs), a novel probabilistic method for modeling TF-DNA interactions, based on log-linear models. Our approach uses sequence features to represent TF binding specificities, where each feature may span multiple positions. We develop the mathematical formulation of our model and devise an algorithm for learning its structural features from binding site data. We also developed a discriminative motif finder, which discovers de novo FMMs that are enriched in target sets of sequences compared to background sets. We evaluate our approach on synthetic data and on the widely used TF chromatin immunoprecipitation (ChIP) dataset of Harbison et al. We then apply our algorithm to high-throughput TF ChIP data from mouse and human, reveal sequence features that are present in the binding specificities of mouse and human TFs, and show that FMMs explain TF binding significantly better than PSSMs. Our FMM learning and motif finder software are available at http://genie.weizmann.ac.il/.


Conflict of interest statement

The authors have declared that no competing interests exist.

Figures

Figure 1
Figure 1. Comparison between FMMs and PSSMs in a toy example of a TFBS with four positions.
(A) Eight input TFBSs that the TF recognizes. (B) A PSSM for the input data in (A), showing its log-linear model network representation, probability distributions over each position, and sequence logo. Note that the PSSM assigns a high probability to CG and GC in positions 2 and 3 as expected by the input data, but it also undesirably (and unavoidably) assigns the same high probability to CC and GG in these positions. (C) An FMM for the input data in (A), showing the associated log-linear model network, with 3 features and sequence logo. Note that features f 1 and f 2 assign a high probability to CG and GC in positions 2 and 3 but not to CC and GG in these positions, as desired.
Figure 2
Figure 2. FMM motif finder flow chart.
The algorithm gets as input (1) sets of positive and negative (in terms of TF binding) unaligned sequences. It then (2) computes for every possible K-mer its enrichment multidimensional hypergeometric p-value (MHG p-value) by finding all its occurrences in the input sequences. The K-mers are ranked by the MHG p-value. (3) Non-significant K-mers are then filtered, using FDR controlled threshold. Next (4) an undirected graph is built. Each K-mer is a vertex, and two K-mers are connected with an edge if their Hamming distance is smaller then H Distance or if they can be aligned without mismatches with a relative shift of up to M Shift (here blue line edge stands for Hamming distance 1 and dotted green edge for Hamming distance 2). The algorithm then (5) iteratively selects the most significant K-mer in the graph and grows a KMM along the edges as described in the text. After each K-mer is associated with exactly one KMM set, (6) all the sets are ranked according to their MHG p-value, and the best M sets are chosen. The process is repeated for every K minKK max and again the overall M best KMM are chosen. Each of the chosen KMMs is used (7) to produce either an FMM or a PSSM motif in the method described in the text. As a last step similar motifs are removed.
Figure 3
Figure 3. Evaluation of our approach on synthetic data.
Results are shown for eight manually constructed models, from which we drew samples and constructed FMMs and PSSMs. The presented models from top down are three synthetic models. A PSSM and an FMM learned from MacIsaac et al. data for the TF GCN4. GCN4 MacIsaac et al. A PSSM learned from the MacIsaac et al. data for the GCN4 transcription factor, with manually addition of eight synthetic features over two positions each (referred as GCN4 PSSM++). A PSSM and an FMM learned from MacIsaac et al. data for the TF SWI5. For each model, shown are its sequence logo (left), training and test log-likelihood (average per instance for the true model, and learned FMM and PSSM) and KL distance of the learned FMM and PSSM models from the true model (train likelihood error bars were excluded for clarity). The height of each feature in the sequence logo is linear with respect to its expectation. Features over more than one position have gray background.
Figure 4
Figure 4. Evaluating our approach on real TFBSs from human.
(A) Train (green points) and test log-likelihood (blue bars), shown as the mean and standard deviation improvements in the average log-likelihood per instance compared to a PSSM for the datasets of NRSF, CTCF predicted sites, and CTCF predicted conserved sites. (B) and (C) show the PSSM and FMM features expectations logo for CTCF predicted conserved sites respectively. (D) and (E) show the same for NRSF sites. Each feature in the FMM feature expectation logo ((B) and (E)) is represented by a box. The horizontal position and the letters in the box define the feature. For example, the feature in the purple dashed box in (C) represent the feature “T at position 2 and A at position 7.” The height of the feature is linear with respect to its expectation in the probability distribution defined by the model. Gray background marks a double position feature.
Figure 5
Figure 5. Evaluating the motif finder on yeast data.
(A) Shown is the fraction of Harbison et al. sets for which a motif was found with better MHG p-value than expected to be found in a set of the same size of randomly selected sequences from Harbison et al. (x-axis). We chose a cutoff that defines as a biologically true motif, a motif with MHG p-value that is worse than at most 16% of the best motif MHG p-value of 1,000 randomly chosen sets. 81% of the Harbison et al. sets contain such a motif. (B) A comparison between KMM motifs predicted by our motif finder and a published combination of predictions by two softwares that use conservation and literature motifs reported in .
Figure 6
Figure 6. Evaluating our approach on real TFBS enriched sequences datasets from human and mouse.
We searched each dataset for de novo motifs using a 5-fold cross validation scheme. We assumed that each sequence in the positive set has at least one TFBS. Following this, we computed for each positive sequence the top motif's FMM and PSSM best TFBS probability and considered it as the sequence binding likelihood. We show here the improvement of our FMM approach over PSSM in terms of train (green dots) and test (blue bars) log average likelihood. In the dataset STAT1_IFNg, two different motifs appear as best/second best in different cross validation runs and are marked by one and two asterisks, respectively.
Figure 7
Figure 7. FMM biological findings.
(A) c-Myc FMM and PSSM. (B) c-Myc FMM and PSSM learned only from sequences of PET3+ clusters (a cleaner set). The black square in (A) and (B) highlights the E-Box motif. (C) Statistics for the c-Myc FMM feature marked by a dashed line. Expected occurrences are according to the PSSM in (B). The p-values were computed using a Binomial test, as described in the Methods section (“Reducing the features space”). (D) CTCF FMM and PSSM. Dashed line squares highlight features that are referenced in the text. (E) Statistics for the CTCF FMM features at positions 15,16 (marked by a dashed line). Expected occurrences are according to the PSSM in (D).

Similar articles

Cited by

References

    1. Gold L, Brown D, He Y, Shtatland T, Singer BS, et al. From oligonucleotide shapes to genomic SELEX: novel biological regulatory loops. Proc Natl Acad Sci U S A. 1997;94:59–64. - PMC - PubMed
    1. Oliphant AR, Brandl CJ, Struhl K. Defining the sequence specificity of DNA-binding proteins by selecting binding sites from random-sequence oligonucleotides: analysis of yeast GCN4 protein. Mol Cell Biol. 1989;9:2944–2949. - PMC - PubMed
    1. Elnitski L, Jin VX, Farnham PJ, Jones SJ. Locating mammalian transcription factor binding sites: a survey of computational and experimental techniques. Genome Res. 2006;16:1455–1464. - PubMed
    1. Bulyk ML, Huang X, Choo Y, Church GM. Exploring the DNA-binding specificities of zinc fingers with DNA microarrays. Proc Natl Acad Sci U S A. 2001;98:7158–7163. - PMC - PubMed
    1. Bulyk ML, Gentalen E, Lockhart DJ, Church GM. Quantifying DNA–protein interactions by double-stranded DNA arrays. Nat Biotechnol. 1999;17:573–577. - PubMed

Publication types

MeSH terms