Structure and dynamics of interphase chromosomes
- PMID: 18725929
- PMCID: PMC2515109
- DOI: 10.1371/journal.pcbi.1000153
Structure and dynamics of interphase chromosomes
Abstract
During interphase chromosomes decondense, but fluorescent in situ hybridization experiments reveal the existence of distinct territories occupied by individual chromosomes inside the nuclei of most eukaryotic cells. We use computer simulations to show that the existence and stability of territories is a kinetic effect that can be explained without invoking an underlying nuclear scaffold or protein-mediated interactions between DNA sequences. In particular, we show that the experimentally observed territory shapes and spatial distances between marked chromosome sites for human, Drosophila, and budding yeast chromosomes can be reproduced by a parameter-free minimal model of decondensing chromosomes. Our results suggest that the observed interphase structure and dynamics are due to generic polymer effects: confined Brownian motion conserving the local topological state of long chain molecules and segregation of mutually unentangled chains due to topological constraints.
Conflict of interest statement
The authors have declared that no competing interests exist.
Figures


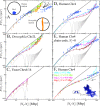
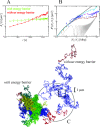
 , where rl(t) is the position vector of the lth bead and r
cm(t) is the center of mass of the configuration at time t. Without barrier, chromosomes swell easier and have larger size (green and red lines, (A)). Comparison amongst internal distances between two sites located at N
1 and N
2 Mbp from one chosen end of the fiber and avalaible experimental data reflects this behavior (B). We have averaged over 3 time windows of exponentially growing size: 240 s<t<2,400 s (dark red line), 2,400 s<t<24,000 s (magenta line) and 24,000 s<t<240,000 s (cyan line). In particular, we notice that the fortuitous agreement of the magenta line with the data is lost due to the fast relaxation to equilibrium. The gray line corresponds to internal distances in the initial configuration. As expected (C), the final configuration of human Chr4 without energy barrier occupies a larger volume and is more random-walk-like than the ones where the energy barrier has been included.

Similar articles
-
Depressing time: Waiting, melancholia, and the psychoanalytic practice of care.In: Kirtsoglou E, Simpson B, editors. The Time of Anthropology: Studies of Contemporary Chronopolitics. Abingdon: Routledge; 2020. Chapter 5. In: Kirtsoglou E, Simpson B, editors. The Time of Anthropology: Studies of Contemporary Chronopolitics. Abingdon: Routledge; 2020. Chapter 5. PMID: 36137063 Free Books & Documents. Review.
-
The transcriptional regulator CBP has defined spatial associations within interphase nuclei.PLoS Comput Biol. 2006 Oct 20;2(10):e139. doi: 10.1371/journal.pcbi.0020139. Epub 2006 Sep 8. PLoS Comput Biol. 2006. PMID: 17054391 Free PMC article.
-
Defining the optimum strategy for identifying adults and children with coeliac disease: systematic review and economic modelling.Health Technol Assess. 2022 Oct;26(44):1-310. doi: 10.3310/ZUCE8371. Health Technol Assess. 2022. PMID: 36321689 Free PMC article.
-
Dynamic Field Theory of Executive Function: Identifying Early Neurocognitive Markers.Monogr Soc Res Child Dev. 2024 Dec;89(3):7-109. doi: 10.1111/mono.12478. Monogr Soc Res Child Dev. 2024. PMID: 39628288 Free PMC article.
-
The effectiveness of abstinence-based and harm reduction-based interventions in reducing problematic substance use in adults who are experiencing homelessness in high income countries: A systematic review and meta-analysis: A systematic review.Campbell Syst Rev. 2024 Apr 21;20(2):e1396. doi: 10.1002/cl2.1396. eCollection 2024 Jun. Campbell Syst Rev. 2024. PMID: 38645303 Free PMC article. Review.
Cited by
-
Space exploration by the promoter of a long human gene during one transcription cycle.Nucleic Acids Res. 2013 Feb 1;41(4):2216-27. doi: 10.1093/nar/gks1441. Epub 2013 Jan 8. Nucleic Acids Res. 2013. PMID: 23303786 Free PMC article.
-
Modeling the 3D genome of plants.Nucleus. 2021 Dec;12(1):65-81. doi: 10.1080/19491034.2021.1927503. Nucleus. 2021. PMID: 34057011 Free PMC article.
-
Colocalization of coregulated genes: a steered molecular dynamics study of human chromosome 19.PLoS Comput Biol. 2013;9(3):e1003019. doi: 10.1371/journal.pcbi.1003019. Epub 2013 Mar 28. PLoS Comput Biol. 2013. PMID: 23555238 Free PMC article.
-
Simulated binding of transcription factors to active and inactive regions folds human chromosomes into loops, rosettes and topological domains.Nucleic Acids Res. 2016 May 5;44(8):3503-12. doi: 10.1093/nar/gkw135. Epub 2016 Apr 8. Nucleic Acids Res. 2016. PMID: 27060145 Free PMC article.
-
Dynamical modeling of three-dimensional genome organization in interphase budding yeast.Biophys J. 2012 Jan 18;102(2):296-304. doi: 10.1016/j.bpj.2011.12.005. Biophys J. 2012. PMID: 22339866 Free PMC article.
References
-
- Alberts B, et al. Molecular Biology of the Cell. 4th edition. New York: Garland Science; 2002.
-
- Rabl C. Über Zellteilung. Morph Jb. 1885;10:214–330.
-
- Cremer T, Cremer C. Rise, fall and resurrection of chromosome territories: a hystorical perspective. Part I. The rise of chromosome territories. Eur J Histochem. 2006;50:161–176. - PubMed
-
- Meaburn KJ, Misteli T. Chromosome territories. Nature. 2007;445:379–381. - PubMed
MeSH terms
Substances
LinkOut - more resources
Full Text Sources
Other Literature Sources
Molecular Biology Databases

