. 2008 Oct;28(20):6373-83.
doi: 10.1128/MCB.00413-08. Epub 2008 Aug 18.

Histone deacetylase inhibitors modify pancreatic cell fate determination and amplify endocrine progenitors

Affiliations

Histone deacetylase inhibitors modify pancreatic cell fate determination and amplify endocrine progenitors

Cécile Haumaitre et al. Mol Cell Biol. 2008 Oct.

Abstract

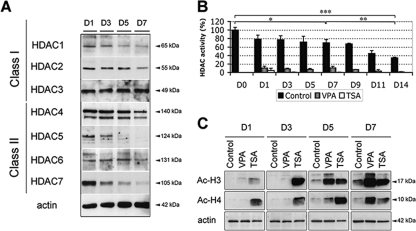
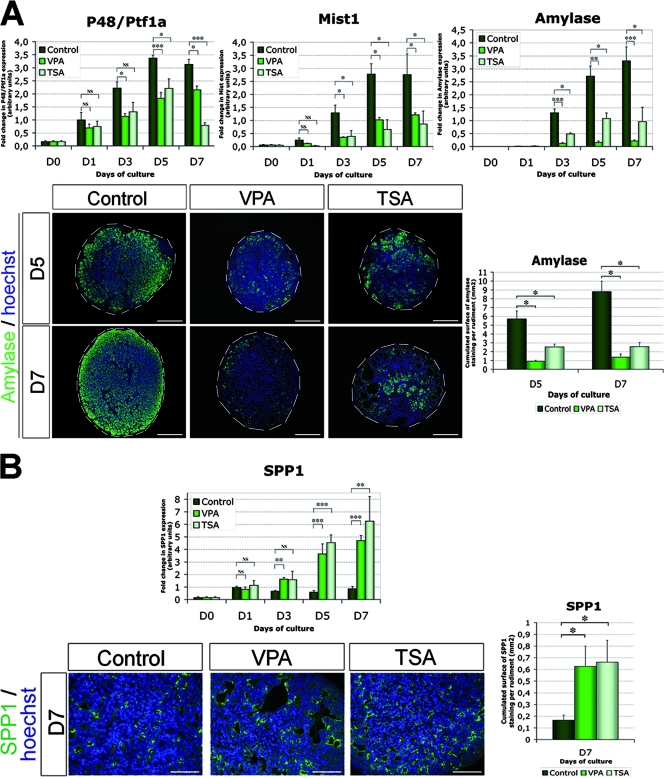
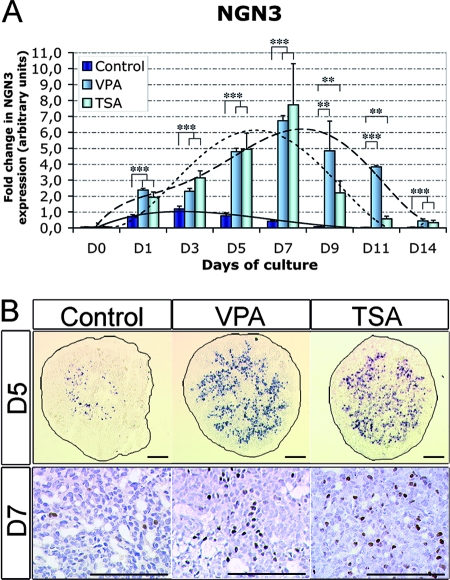
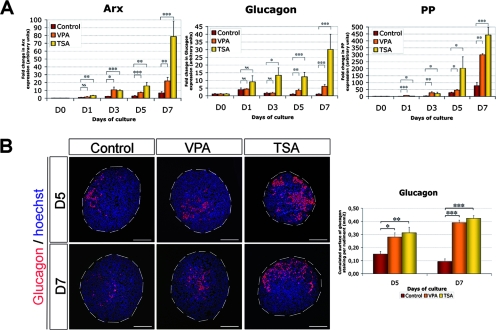
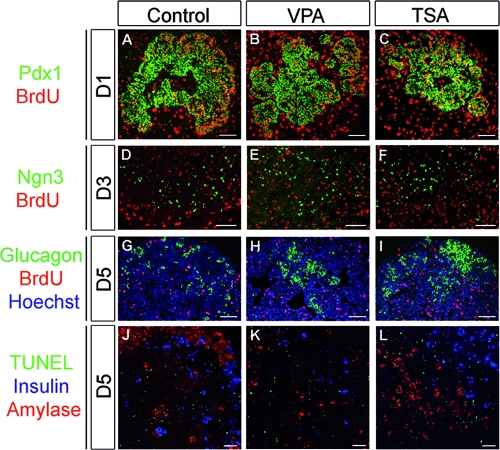
During pancreas development, transcription factors play critical roles in exocrine and endocrine differentiation. Transcriptional regulation in eukaryotes occurs within chromatin and is influenced by posttranslational histone modifications (e.g., acetylation) involving histone deacetylases (HDACs). Here, we show that HDAC expression and activity are developmentally regulated in the embryonic rat pancreas. We discovered that pancreatic treatment with different HDAC inhibitors (HDACi) modified the timing and determination of pancreatic cell fate. HDACi modified the exocrine lineage via abolition and enhancement of acinar and ductal differentiation, respectively. Importantly, HDACi treatment promoted the NGN3 proendocrine lineage, leading to an increased pool of endocrine progenitors and modified endocrine subtype lineage choices. Interestingly, treatments with trichostatin A and sodium butyrate, two inhibitors of both class I and class II HDACs, enhanced the pool of beta cells. These results highlight the roles of HDACs at key points in exocrine and endocrine differentiation. They show the powerful use of HDACi to switch pancreatic cell determination and amplify specific cellular subtypes, with potential applications in cell replacement therapies in diabetes.


Figures

FIG. 1.
FIG. 1.
HDAC expression and activity during pancreas development in vivo. (A) Western blot analysis of the expression of HDAC proteins (HDAC1 to -3, class I; HDAC4 to -7, class II) in vivo in E13.5, E17.5, and adult rat pancreatic extracts. (B) Total HDAC enzymatic activity from E13.5 (set to 100%) to adult pancreatic extracts. (C) Western blot analysis of histone acetylation with antibodies against histone acetyl-H3 and acetyl-H4 residues in E13.5, E17.5, and adult rat pancreatic extracts. The values are means plus SEM of three independent experiments. *, P < 0.05; **, P < 0.005; ***, P < 0.001.
FIG. 2.
FIG. 2.
HDAC expression and activity in pancreases cultured in vitro with and without HDACi. (A) Western blot analysis of the expression of different HDAC proteins in pancreatic extracts after 1, 3, 5, and 7 days in culture (D1, D3, D5, and D7, respectively). (B) Total HDAC enzymatic activity in control and VPA- or TSA-treated cell extracts from day 0 (E13.5; D0; set to 100%) to day 14 (D14). (C) Western blot analysis of histone acetylation after 1, 3, 5, or 7 days in culture in control and VPA- or TSA-treated pancreases. The values are means plus SEM of three independent experiments. *, P < 0.05; **, P < 0.005; ***, P < 0.001.
FIG. 3.
FIG. 3.
Morphological effect of HDACi treatment on the embryonic rat pancreas. E13.5 rat pancreases were cultured at the air-medium interface for different periods (day 1 to day 7) without or with HDACi. VPA and TSA were used at 1 mM and 100 nM, respectively. Representative images after 1 (A, F, and K), 3 (B, G, and L), 5 (C, H, and M), and 7 (D, I, and N) days in culture are shown. In panels A to C, F to H, and K to M, the epithelium is circled in red. A branched epithelium (red arrowheads) was observed with HDACi treatment after 3 days in culture (panels G and L versus B and H, and M versus C). Cystic structures (red asterisks) were observed with HDACi treatment, and especially with TSA, after 7 days in culture (panels I and N versus D). (E, J, and O) Hematoxylin/eosin staining after 7 days of culture. Cystic structures were seen (black asterisks). Fewer acinar structures were observed with VPA and TSA than in the control (black arrows). Scale bar, 50 μm.
FIG. 4.
FIG. 4.
Effect of HDACi treatment on exocrine differentiation. (A) Real-time PCR quantification of P48/Ptf1a, Mist1, and amylase mRNAs after 0, 1, 3, 5, and 7 days in culture (D0, D1, D3, D5, and D7, respectively) with and without VPA or TSA treatment. Immunohistological analyses of pancreases after 5 and 7 days in culture with and without VPA or TSA treatment were performed. Acinar differentiation was evaluated by amylase staining (green). Nuclei were stained in blue with Hoechst stain. The absolute surface areas occupied by amylase+ cells that developed after 5 and 7 days of culture with and without VPA or TSA treatment were quantified. The values are means plus SEM of at least three independent experiments. NS, no significant difference; *, P < 0.05; **, P < 0.005; ***, P < 0.001. Scale bar, 100 μm. (B) Real-time PCR quantification of SPP1 mRNA after 0, 1, 3, 5, and 7 days of culture with and without VPA or TSA treatment. Immunohistological analysis of pancreases after 7 days in culture with and without VPA or TSA treatment was performed. Ductal differentiation was evaluated using anti-SPP1 staining (green). Nuclei were stained in blue with Hoechst stain. The absolute surface areas occupied by SPP1+ cells that developed after 7 days of culture with and without VPA or TSA treatment were quantified. The values are means plus SEM of at least three independent experiments. NS, no significant difference; *, P < 0.05; **, P < 0.005; ***, P < 0.001. Scale bar, 100 μm.
FIG. 5.
FIG. 5.
HDACi treatment enhances the pool of Ngn3 endocrine progenitor cells. (A) Real-time PCR quantification of Ngn3 mRNA after 0, 1, 3, 5, 7, 9, 11, and 14 days in culture (D0, D1, D3, D5, D7, D9, and D11 respectively), with and without VPA or TSA treatment. The values are means plus SEM of at least three independent experiments. **, P < 0.005; ***, P < 0.001. (B) (Top) Detection of Ngn3 transcripts by in situ hybridization in pancreases cultured for 5 days with and without VPA or TSA treatment. (Bottom) Detection of Ngn3 protein by immunohistochemistry in pancreases cultured for 7 days with and without VPA or TSA treatment. Scale bar, 100 μm.
FIG. 6.
FIG. 6.
HDACi treatment increases endocrine α/PP lineage differentiation. (A) Real-time PCR quantification of Arx, glucagon, and PP mRNAs after 0, 1, 3, 5, and 7 days in culture (D0, D1, D3, D5, and D7, respectively) with and without VPA or TSA treatment. (B) Immunohistological analyses of pancreases after 5 and 7 days in culture with and without VPA or TSA treatment. α-cell development was evaluated using antiglucagon staining (red). Nuclei were stained in blue with Hoechst stain. The absolute surface areas occupied by glucagon+ cells that developed after 5 and 7 days in culture with and without VPA or TSA treatment were quantified. The values are means plus SEM of at least three independent experiments. NS, no significant difference; *, P < 0.05; **, P < 0.005; ***, P < 0.001. Scale bar, 100 μm.
FIG. 7.
FIG. 7.
Opposite effects of VPA and TSA treatments on endocrine β/δ lineage differentiation. (A) Real-time PCR quantification of Pax4, NeuroD1, insulin, and somatostatin mRNAs after 0, 1, 3, 5, and 7 days in culture (D0, D1, D3, D5, and D7, respectively) with and without VPA or TSA treatment. (B) Immunohistological analyses of pancreases after 5 and 7 days in culture with and without VPA or TSA treatment. β-Cell development was evaluated using anti-insulin staining (red). Nuclei were stained in blue with Hoechst stain. The absolute surface areas occupied by insulin+ cells that developed after 5 and 7 days in culture with and without VPA or TSA were quantified. (C) Representative images of pancreases cultured for 9, 11, and 14 days with and without VPA or TSA treatment. Note that with TSA treatment, at days 11 and 14, translucent buds could be seen (black arrows). (D) Real-time PCR quantification of insulin mRNA after 7, 9, 11, and 14 days of culture with and without VPA or TSA treatment. (E) Immunohistological analyses of pancreases after 14 days of culture with and without VPA or TSA treatment. β-Cell development was evaluated using anti-insulin staining (red). Nuclei were stained in blue with Hoechst stain. Note that in TSA-treated explants, insulin staining (white arrow) corresponds to the translucent bud seen in panel C (black arrow). The absolute surface areas occupied by insulin+ cells that developed after 14 days of culture without or with VPA or TSA treatment were quantified. The values are means plus SEM of at least three independent experiments. NS, no significant difference; *, P < 0.05; **, P < 0.005; ***, P < 0.001. Scale bar, 100 μm.
FIG. 8.
FIG. 8.
HDACi treatment does not modify proliferation or apoptosis. Pancreases were pulsed with BrdU during the last hour of culture. BrdU staining was analyzed immunohistochemically (red) with Pdx1 staining (green) at day 1 (D1) (A, B, and C), with Ngn3 staining (green) at day 3 (D, E, and F), and with glucagon staining (green) at day 5 (G, H, and I). (G, H, and I) Proliferative PDX1 cells at day 1 are yellow. Nuclei were stained in blue with Hoechst stain at day 5. (J, K, and L) TUNEL staining was visualized (green) at day 5 with insulin staining (blue) and amylase staining (red). Scale bar = 50 μm.

Similar articles

Cited by

References

    1. Apelqvist, A., H. Li, L. Sommer, P. Beatus, D. J. Anderson, T. Honjo, M. Hrabe de Angelis, U. Lendahl, and H. Edlund. 1999. Notch signalling controls pancreatic cell differentiation. Nature 400877-881. - PubMed
    1. Attali, M., V. Stetsyuk, A. Basmaciogullari, V. Aiello, M. A. Zanta-Boussif, B. Duvillie, and R. Scharfmann. 2007. Control of beta-cell differentiation by the pancreatic mesenchyme. Diabetes 561248-1258. - PubMed
    1. Backs, J., and E. N. Olson. 2006. Control of cardiac growth by histone acetylation/deacetylation. Circ. Res. 9815-24. - PubMed
    1. Bhushan, A., N. Itoh, S. Kato, J. P. Thiery, P. Czernichow, S. Bellusci, and R. Scharfmann. 2001. Fgf10 is essential for maintaining the proliferative capacity of epithelial progenitor cells during early pancreatic organogenesis. Development 1285109-5117. - PubMed
    1. Cano, D. A., S. Sekine, and M. Hebrok. 2006. Primary cilia deletion in pancreatic epithelial cells results in cyst formation and pancreatitis. Gastroenterology 1311856-1869. - PubMed

Publication types

MeSH terms