. 2008 Oct;28(20):6342-57.
doi: 10.1128/MCB.00766-08. Epub 2008 Aug 18.

The histone acetyltransferase PCAF associates with actin and hnRNP U for RNA polymerase II transcription

Affiliations

The histone acetyltransferase PCAF associates with actin and hnRNP U for RNA polymerase II transcription

Ales Obrdlik et al. Mol Cell Biol. 2008 Oct.

Abstract

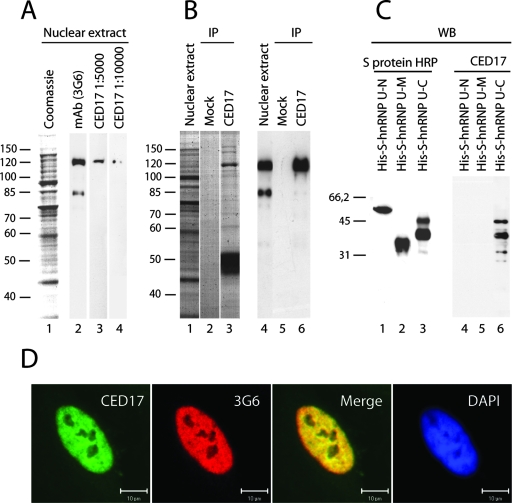
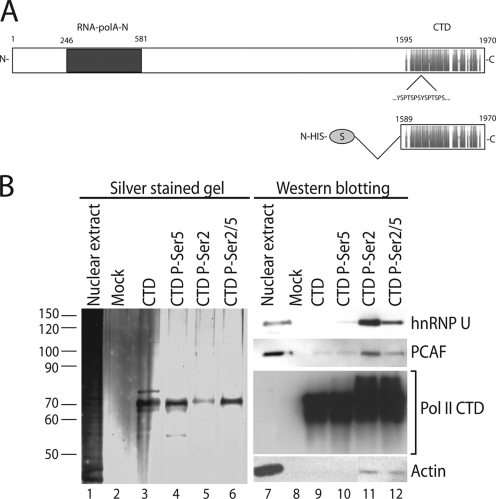
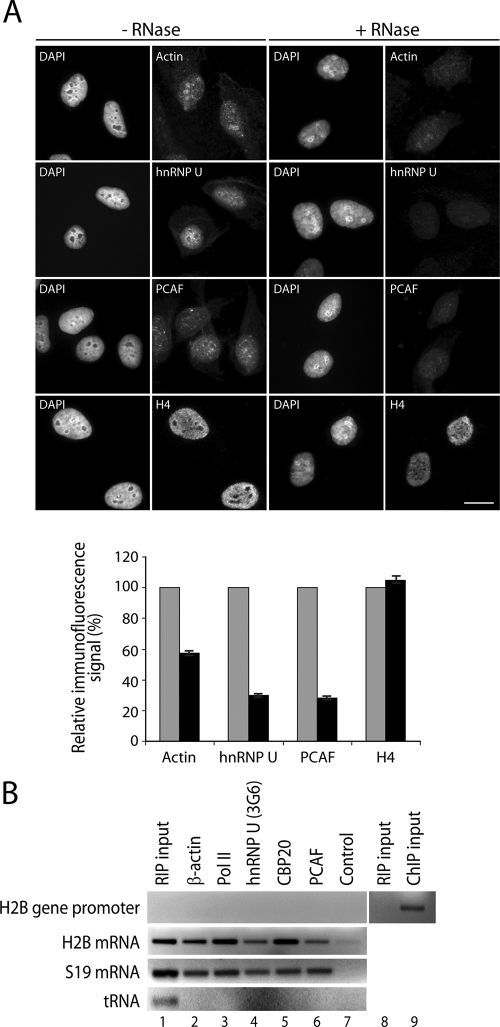
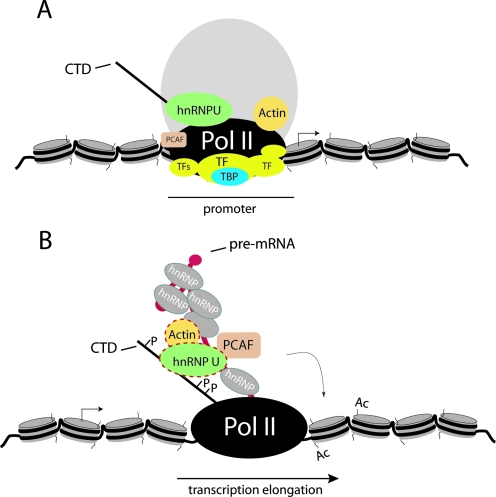
Actin is a key regulator of RNA polymerase (pol) II transcription. In complex with specific hnRNPs, it has been proposed that actin functions to recruit pol II coactivators during the elongation of nascent transcripts. Here, we show by affinity chromatography, protein-protein interaction assays, and biochemical fractionation of nuclear extracts that the histone acetyltransferase (HAT) PCAF associates with actin and hnRNP U. PCAF and the nuclear actin-associated HAT activity detected in the DNase I-bound protein fraction could be released by disruption of the actin-hnRNP U complex. In addition, actin, hnRNP U, and PCAF were found to be associated with the Ser2/5- and Ser2-phosphorylated pol II carboxy-terminal domain construct. Chromatin and RNA immunoprecipitation assays demonstrated that actin, hnRNP U, and PCAF are present at the promoters and coding regions of constitutively expressed pol II genes and that they are associated with ribonucleoprotein complexes. Finally, disruption of the actin-hnRNP U interaction repressed bromouridine triphosphate incorporation in living cells, suggesting that actin and hnRNP U cooperate with PCAF in the regulation of pol II transcription elongation.


Figures

FIG. 1.
FIG. 1.
PCAF is associated with actin and hnRNP U. (A) DNase I affinity chromatography reveals the association of PCAF with nuclear actin. (B) Coimmunoprecipitation of actin, hnRNP U, and pol II with anti-PCAF antibodies from HeLa nuclear extracts. The mock experiment corresponds to nuclear extracts incubated only with protein A/G-Sepharose. Control immunoprecipitation (IP) was a polyclonal anti-GFP antibody. (C) Schematic representation of the hnRNP U constructs used in this study. The C-terminal actin-binding motif is highlighted. The amino acid residues R and K required for actin binding are in boldface. (D) Actin, PCAF, and pol II are specifically precipitated from nuclear extracts with the hnRNP U-C construct (lane 4) but not with the hnRNP U-N (lane 2) or the hnRNP U-M (lane 3) construct. (E) A complex containing actin, hnRNP U, PCAF, and pol II is coprecipitated from nuclear extracts with an anti-β-actin antibody. Numbers at left indicate molecular mass in kDa.
FIG. 2.
FIG. 2.
Characterization of the anti-hnRNP U antibody CED17. (A) Western blotting analysis of nuclear extracts was prepared from HeLa cells (lanes 3 and 4) and compared with the anti-hnRNP U monoclonal antibody 3G6 (lane 2). (B) Nuclear extracts were subjected to immunoprecipitations with CED17. Precipitated proteins were resolved by SDS-PAGE (lanes 1 to 3) and analyzed on immunoblots with the 3G6 antibody (cf. lanes 4 to 6). (C) CED17 specifically recognized the recombinantly expressed and purified hnRNP U-C construct as revealed on immunoblots (lane 6). HRP, horseradish peroxidase. (D) CED17 exhibits nuclear staining and colocalizes with the the monoclonal anti-hnRNP U 3G6 antibody in HeLa cells (scale bar, 10 μm). Numbers at left indicate molecular mass in kDa.
FIG. 3.
FIG. 3.
Disruption of the actin-hnRNP U complex releases PCAF. (A) DNase I affinity chromatography performed with nuclear extracts preincubated with increasing amounts of CED17 antibody (+Ab) or a control antibody. Lanes 1, nuclear extract; 2, no competing antibody; 3 to 5, decreasing amounts of competing antibody; 6, control antibody. (B) Pull-down experiment using the hnRNP U-C construct bound to protein S-agarose beads. Nuclear extracts were preincubated with CED17 or a control antibody and subjected to pull-down experiments with hnRNP U-C beads. Bound proteins were resolved by SDS-PAGE and analyzed on immunoblots. Lanes 1, nuclear extract; 2, mock experiment where unconjugated beads are incubated with nuclear extracts; 3, no competing antibody; 4, preincubation with CED17; 5, preincubation with control antibody. (C) Immunoprecipitations using CED17. After nuclear extracts were precleared with protein A/G-Sepharose, they were subjected to immunoprecipitation with CED17. Bound proteins were resolved by SDS-PAGE and revealed on immunoblots. Lanes 1, nuclear extract; 2, mock experiment where protein A/G-Sepharose beads are incubated with nuclear extracts for preclearing; 3, CED17 immunoprecipitated proteins.
FIG. 4.
FIG. 4.
Actin, hnRNP U, PCAF, and pol II are part of the same native complex. (A) Resolution of actin containing nuclear complexes by gel filtration. Fractions obtained from a Superose 6HR column were analyzed on Western blots. The position of the 670-kDa marker (thyroglobulin) is indicated. Void, void volume. (B and C) Resolution of actin-containing nuclear complexes with a Superose 6HR column following preincubation of HeLa nuclear extracts with 30 ng/μl CED17 or nonspecific polyclonal rabbit IgGs, respectively.
FIG. 5.
FIG. 5.
Disruption of the actin-hnRNP U interaction represses HAT activity. Nuclear extracts were subjected to DNase I affinity chromatography, and bound proteins were assayed for any HAT activity by using purified core histones as substrate. DNase I pull-down experiment was performed after preincubation of nuclear extracts with increasing amounts of CED17 or a control nonspecific rabbit IgG. Measurements were performed by liquid scintillation. Counts are normalized relative to the bound protein fraction obtained in the absence of the competing CED17 antibody. Experiments were successfully reproduced up to five times. Bars depict standard deviations.
FIG. 6.
FIG. 6.
Actin, hnRNP U, and PCAF are associated with specific phosphorylation states of the pol II CTD. (A) Schematic representation of the recombinant S-tagged CTD construct used in this study. (B) Recombinantly expressed CTD was bound to protein S-agarose and phosphorylated with cdk7, cdk9, or with both to obtain Ser5-specifc, Ser2-specific, and Ser2/5-specific CTD phosphorylation (P) states, respectively. The beads were incubated with nuclear extracts, and bound proteins were resolved by SDS-PAGE (lanes 1 to 6) and analyzed on immunoblots (lanes 7 to 12). The mock experiment was performed by incubating unconjugated protein S-agarose beads with nuclear extracts. Numbers at left indicate molecular mass in kDa.
FIG. 7.
FIG. 7.
Actin, hnRNP U, and PCAF are associated with constitutively expressed genes, as determined by ChIP analysis. Lysates of cross-linked cells treated or untreated with the HDAC inhibitor TSA (+TSA, −TSA, respectively) were incubated with the indicated antibodies, and coprecipitated DNA was subjected to PCR using primers that amplify promoter and coding regions of the β-tubulin, S19, and GAPDH genes, as well as the 5S and 5.8S genes. Lanes 8 and 17, PCR amplification of 0.5% input chromatin.
FIG. 8.
FIG. 8.
Relative occupancies at individual promoters and coding regions of actin, hnRNP U, and PCAF. The bar diagrams show the relative amounts of gene promoters and coding regions precipitated with antibodies against actin, hnRNP U (3G6), PCAF, β-actin, TBP, histone H3, and hnRNP U (CED17), as well as with a nonspecific rabbit IgG used as control, calculated in the absence (A) and presence (B) of TSA. Values were obtained by densitometric calculations of PCR products resolved by agarose gel electrophoresis (and revealed by ethidium bromide staining) in three independent experiments. Error bars represent standard deviations.
FIG. 8.
FIG. 8.
Relative occupancies at individual promoters and coding regions of actin, hnRNP U, and PCAF. The bar diagrams show the relative amounts of gene promoters and coding regions precipitated with antibodies against actin, hnRNP U (3G6), PCAF, β-actin, TBP, histone H3, and hnRNP U (CED17), as well as with a nonspecific rabbit IgG used as control, calculated in the absence (A) and presence (B) of TSA. Values were obtained by densitometric calculations of PCR products resolved by agarose gel electrophoresis (and revealed by ethidium bromide staining) in three independent experiments. Error bars represent standard deviations.
FIG. 9.
FIG. 9.
Average occupancies at promoter and coding regions in the absence (A) and presence (B) of TSA. Bar diagrams represent average values calculated from the analysis of all promoters and coding regions of the β-tubulin, S19, and GAPDH genes coprecipitated in three independent ChIP experiments using the indicated antibodies (two-tailed Student's t test, 0.01 < ** < 0.05). The values are normalized relative to the signal values obtained in ChIP experiments using an anti-histone H3 antibody. The levels of occupancy were calculated for each individual gene promoter and coding region in the presence and absence of TSA treatment, respectively (data not shown).
FIG. 10.
FIG. 10.
Actin, hnRNP U, and PCAF are associated with nascent ribonucleoprotein complexes. (A) The intranuclear distributions of actin, hnRNP U, and PCAF are sensitive to RNase treatment. HeLa cells were permeabilized with Triton X-100 (0.1%, 10 min, room temperature) and treated with RNase A (1 mg/ml, 10 min, room temperature) prior to fixation. After treatment, cells were immunostained with antibodies to actin, hnRNP U, PCAF, fibrillarin, and histone H4. The protein distributions were analyzed by wide-field microscopy. Quantification was performed by measurements taken from selected regions of interest corresponding to different subnuclear domains. Three different regions were selected randomly for each nucleus on the 4′,6′-diamidino-2-phenylindole (DAPI)-stained images, excluding nucleoli. The three selected regions were used to measure the Alexa 488 or Alexa 568 signals derived from the fluorochrome-conjugated secondary antibodies. The signal was quantified using ImageJ software. For each region, the mean gray value was registered after background normalization. The number of regions measured for actin, hnRNPU, PCAF, and H4 was between 89 and 67. The mean gray values were averaged and expressed as percentages on histograms. The average of the mean gray values measured in control cells was determined to be 100% of signal, and the average of the mean gray values measured after RNase treatment was expressed proportionately. Error bars represent standard deviations. (B) RIP analysis. Lysates of cross-linked cells were incubated with the indicated antibodies, and coprecipitated RNA was subjected to reverse transcription-PCR (RT-PCR) using primers that amplify the H2B gene promoter, H2B mRNA, S19 mRNA, and tRNATyr. Lane 1 shows PCR amplification of 1.5% input RNA. Lanes 8 and 9, RIP and ChIP inputs were analyzed by PCR with H2B promoter-specific primers.
FIG. 11.
FIG. 11.
In vivo disruption of the actin-hnRNP U interaction represses pol II transcription in a HAT-dependent manner. (A) The CED17 antibody or nonspecific polyclonal rabbit IgGs were injected into nuclei or cytoplasm (as control) of HeLa cells. After cells were injected, DRB was washed away and cells were incubated for 1 h at 37°C. Cells were then subjected to BrUTP incorporation to measure the effect of the CED17 antibody on pol II transcription. The injected antibody was visualized with an Alexa 488-conjugated goat anti-rabbit antibody. The incorporated BrUTP was visualized with a monoclonal anti-BrUTP antibody. Panel A shows examples of injected and noninjected HeLa cells after treatment with DRB. Arrows indicate CED17 or IgG nuclear injections, whereas arrowheads indicate cytoplasmic injections of CED17 (scale bar, 10 μm). (B) The bar diagram shows the coefficient of BrUTP incorporation (the ratio of cells which did not incorporate BrUTP relative to those that incorporated BrUTP following CED17 injection) after cells were counted directly by microscopy. Where indicated, experiments were performed in the presence of DRB (DRB treated), TSA (TSA treated), or DRB and TSA simultaneously (DRB-TSA treated). Error bars represent standard deviations.
FIG. 12.
FIG. 12.
Association of actin, hnRNP U, and PCAF with the gene coding region is dependent on the phosphorylated pol II CTD. (A) Lysates of cross-linked HeLa cells treated or untreated with the CDK inhibitor DRB at different time points were incubated with the indicated antibodies and coprecipitated DNA was subjected to PCR using primers that amplify coding region of the S19 gene. Lane 7, PCR amplification of 0.5% input chromatin. (B) Effect of DRB on the association of pol II CTD, hnRNP U, PCAF, and actin with active genes: densitometric quantification of relative signals obtained in the above-described ChIP experiments in the absence and presence of DRB treatment. The bar diagrams represent average values calculated from analysis of the coding region of the S19 gene coprecipitated in three independent ChIP experiments using the indicated antibodies. The values for hnRNP U, PCAF, β-actin, and phosphorylated (P)-Ser2 pol II CTD (H5 antibody) are normalized against the signals obtained using the pol II antibody 8WG16. (C) Densitometric quantification of the relative signals obtained in the ChIP experiments with the antibody against acetylated H3K9 in the absence and presence of DRB treatment. Average values from analysis of the S19 gene coding region coprecipitated in three independent ChIP experiments are normalized against the anti-histone H3 antibody.
FIG. 13.
FIG. 13.
Model for actin-hnRNP U-mediated control of pol II transcription elongation. (A) Actin and hnRNP U may not be in contact during transcription initiation (TF, transcription factors). (B) During transcription, actin may be recruited to the elongating transcription machinery via the hyperphosphorylated CTD and then to the nascent RNP, where actin in complex with the hnRNP U could facilitate recruitment of PCAF to the active gene to enhance the processivity of the elongating pol II.

Similar articles

Cited by

References

    1. Brand, M., K. Yamamoto, A. Staub, and L. Tora. 1999. Identification of TATA-binding protein-free TAFII-containing complex subunits suggests a role in nucleosome acetylation and signal transduction. J. Biol. Chem. 27418285-18289. - PubMed
    1. Candau, R., P. A. Moore, L. Wang, N. Barlev, C. Y. Ying, C. A. Rosen, and S. L. Berger. 1996. Identification of human proteins functionally conserved with the yeast putative adaptors ADA2 and GCN5. Mol. Cell. Biol. 16593-602. - PMC - PubMed
    1. Fomproix, N., and P. Percipalle. 2004. An actin-myosin complex on actively transcribing genes. Exp. Cell Res. 294140-148. - PubMed
    1. Gilbert, C., A. Kristjuhan, G. S. Winkler, and J. Q. Svejstrup. 2004. Elongator interactions with nascent mRNA revealed by RNA immunoprecipitation. Mol. Cell 14:457-464. - PubMed
    1. Hofmann, W. A., L. Stojiljkovic, B. Fuchsova, G. M. Vargas, E. Mavrommatis, V. Philimonenko, K. Kysela, J. A. Goodrich, J. L. Lessard, T. J. Hope, P. Hozak, and P. de Lanerolle. 2004. Actin is part of pre-initiation complexes and is necessary for transcription by RNA polymerase II. Nat. Cell Biol. 6:1094-1101. - PubMed

Publication types

MeSH terms

LinkOut - more resources