Small intestinal CD103+ dendritic cells display unique functional properties that are conserved between mice and humans
- PMID: 18710932
- PMCID: PMC2526207
- DOI: 10.1084/jem.20080414
Small intestinal CD103+ dendritic cells display unique functional properties that are conserved between mice and humans
Abstract
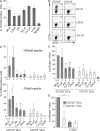
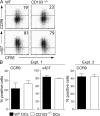
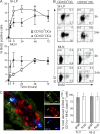
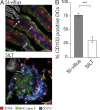
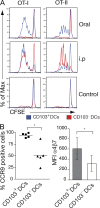
A functionally distinct subset of CD103(+) dendritic cells (DCs) has recently been identified in murine mesenteric lymph nodes (MLN) that induces enhanced FoxP3(+) T cell differentiation, retinoic acid receptor signaling, and gut-homing receptor (CCR9 and alpha4beta7) expression in responding T cells. We show that this function is specific to small intestinal lamina propria (SI-LP) and MLN CD103(+) DCs. CD103(+) SI-LP DCs appeared to derive from circulating DC precursors that continually seed the SI-LP. BrdU pulse-chase experiments suggested that most CD103(+) DCs do not derive from a CD103(-) SI-LP DC intermediate. The majority of CD103(+) MLN DCs appear to represent a tissue-derived migratory population that plays a central role in presenting orally derived soluble antigen to CD8(+) and CD4(+) T cells. In contrast, most CD103(-) MLN DCs appear to derive from blood precursors, and these cells could proliferate within the MLN and present systemic soluble antigen. Critically, CD103(+) DCs with similar phenotype and functional properties were present in human MLN, and their selective ability to induce CCR9 was maintained by CD103(+) MLN DCs isolated from SB Crohn's patients. Thus, small intestinal CD103(+) DCs represent a potential novel target for regulating human intestinal inflammatory responses.
Figures


Similar articles
-
Functional specialization of gut CD103+ dendritic cells in the regulation of tissue-selective T cell homing.J Exp Med. 2005 Oct 17;202(8):1063-73. doi: 10.1084/jem.20051100. Epub 2005 Oct 10. J Exp Med. 2005. PMID: 16216890 Free PMC article.
-
Bile retinoids imprint intestinal CD103+ dendritic cells with the ability to generate gut-tropic T cells.Mucosal Immunol. 2011 Jul;4(4):438-47. doi: 10.1038/mi.2010.91. Epub 2011 Feb 2. Mucosal Immunol. 2011. PMID: 21289617 Free PMC article.
-
Mesenteric lymph node CD11b- CD103+ PD-L1High dendritic cells highly induce regulatory T cells.Immunology. 2017 Sep;152(1):52-64. doi: 10.1111/imm.12747. Epub 2017 Jun 1. Immunology. 2017. PMID: 28423181 Free PMC article.
-
How vitamin A metabolizing dendritic cells are generated in the gut mucosa.Trends Immunol. 2012 Jan;33(1):42-8. doi: 10.1016/j.it.2011.10.001. Epub 2011 Nov 11. Trends Immunol. 2012. PMID: 22079120 Review.
-
Development and functional specialization of CD103+ dendritic cells.Immunol Rev. 2010 Mar;234(1):268-81. doi: 10.1111/j.0105-2896.2009.00874.x. Immunol Rev. 2010. PMID: 20193025 Review.
Cited by
-
The effects of TLR activation on T-cell development and differentiation.Clin Dev Immunol. 2012;2012:836485. doi: 10.1155/2012/836485. Epub 2012 Jun 7. Clin Dev Immunol. 2012. PMID: 22737174 Free PMC article. Review.
-
Efficacy and safety of etrolizumab in the treatment of inflammatory bowel disease: a meta-analysis.PeerJ. 2024 Aug 23;12:e17945. doi: 10.7717/peerj.17945. eCollection 2024. PeerJ. 2024. PMID: 39193512 Free PMC article.
-
Isolation and characterization of dendritic cells and macrophages from the mouse intestine.J Vis Exp. 2012 May 21;(63):e4040. doi: 10.3791/4040. J Vis Exp. 2012. PMID: 22644046 Free PMC article.
-
CD11c(+) monocyte/macrophages promote chronic Helicobacter hepaticus-induced intestinal inflammation through the production of IL-23.Mucosal Immunol. 2016 Mar;9(2):352-63. doi: 10.1038/mi.2015.65. Epub 2015 Aug 5. Mucosal Immunol. 2016. PMID: 26242598 Free PMC article.
-
(Not) Home alone: Antigen presenting cell - T Cell communication in barrier tissues.Front Immunol. 2022 Sep 29;13:984356. doi: 10.3389/fimmu.2022.984356. eCollection 2022. Front Immunol. 2022. PMID: 36248804 Free PMC article. Review.
References
-
- Banchereau, J., F. Briere, C. Caux, J. Davoust, S. Lebecque, Y.J. Liu, B. Pulendran, and K. Palucka. 2000. Immunobiology of dendritic cells. Annu. Rev. Immunol. 18:767–811. - PubMed
-
- Steinman, R.M., and H. Hemmi. 2006. Dendritic cells: translating innate to adaptive immunity. Curr. Top. Microbiol. Immunol. 311:17–58. - PubMed
-
- Henri, S., D. Vremec, A. Kamath, J. Waithman, S. Williams, C. Benoist, K. Burnham, S. Saeland, E. Handman, and K. Shortman. 2001. The dendritic cell populations of mouse lymph nodes. J. Immunol. 167:741–748. - PubMed
-
- Shortman, K., and Y.J. Liu. 2002. Mouse and human dendritic cell subtypes. Nat. Rev. Immunol. 2:151–161. - PubMed
Publication types
MeSH terms
Substances
Grants and funding
LinkOut - more resources
Full Text Sources
Other Literature Sources
Research Materials

