

The redox environment in the mitochondrial intermembrane space is maintained separately from the cytosol and matrix
- PMID: 18708636
- PMCID: PMC2570890
- DOI: 10.1074/jbc.M803028200
The redox environment in the mitochondrial intermembrane space is maintained separately from the cytosol and matrix
Abstract
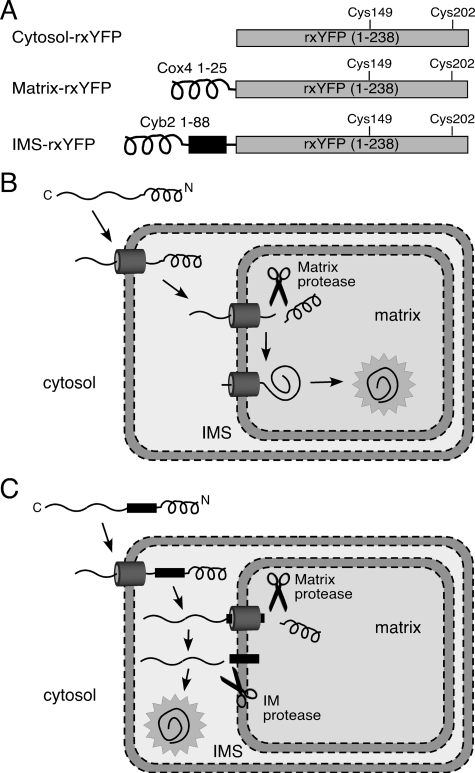
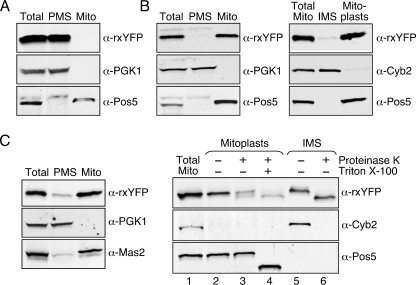
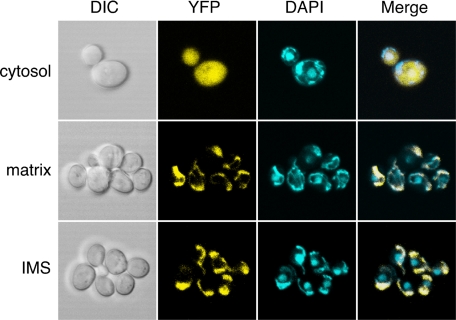
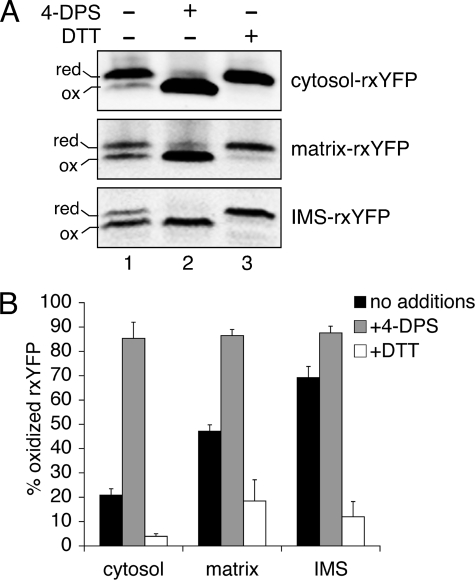
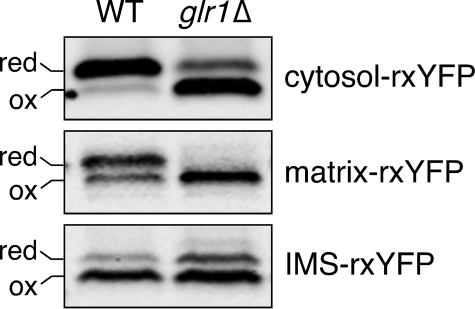
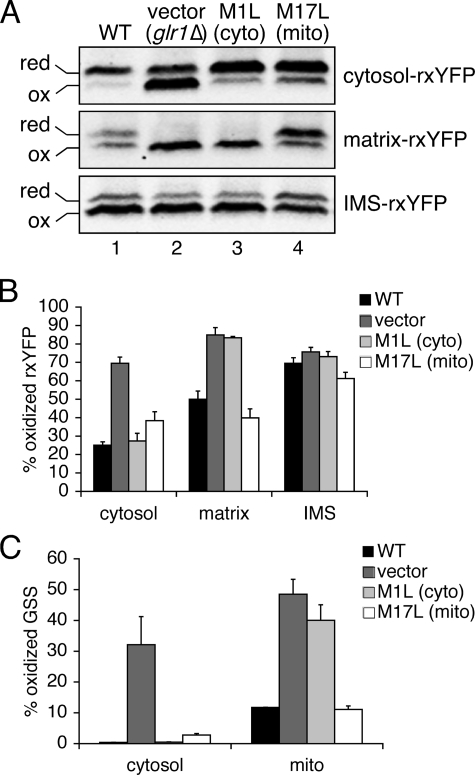
Redox control in the mitochondrion is essential for the proper functioning of this organelle. Disruption of mitochondrial redox processes contributes to a host of human disorders, including cancer, neurodegenerative diseases, and aging. To better characterize redox control pathways in this organelle, we have targeted a green fluorescent protein-based redox sensor to the intermembrane space (IMS) and matrix of yeast mitochondria. This approach allows us to separately monitor the redox state of the matrix and the IMS, providing a more detailed picture of redox processes in these two compartments. To verify that the sensors respond to localized glutathione (GSH) redox changes, we have genetically manipulated the subcellular redox state using oxidized GSH (GSSG) reductase localization mutants. These studies indicate that redox control in the cytosol and matrix are maintained separately by cytosolic and mitochondrial isoforms of GSSG reductase. Our studies also demonstrate that the mitochondrial IMS is considerably more oxidizing than the cytosol and mitochondrial matrix and is not directly influenced by endogenous GSSG reductase activity. These redox measurements are used to predict the oxidation state of thiol-containing proteins that are imported into the IMS.
Figures
Similar articles
-
Redox-sensitive YFP sensors monitor dynamic nuclear and cytosolic glutathione redox changes.Free Radic Biol Med. 2012 Jun 1-15;52(11-12):2254-65. doi: 10.1016/j.freeradbiomed.2012.04.004. Epub 2012 Apr 17. Free Radic Biol Med. 2012. PMID: 22561702 Free PMC article.
-
Glutathione redox potential in the mitochondrial intermembrane space is linked to the cytosol and impacts the Mia40 redox state.EMBO J. 2012 Jun 15;31(14):3169-82. doi: 10.1038/emboj.2012.165. EMBO J. 2012. PMID: 22705944 Free PMC article.
-
Mitochondrial Glutathione: Regulation and Functions.Antioxid Redox Signal. 2017 Nov 20;27(15):1162-1177. doi: 10.1089/ars.2017.7121. Epub 2017 Jun 30. Antioxid Redox Signal. 2017. PMID: 28558477 Review.
-
Redox-sensitive YFP sensors for monitoring dynamic compartment-specific glutathione redox state.Free Radic Biol Med. 2013 Dec;65:436-445. doi: 10.1016/j.freeradbiomed.2013.07.033. Epub 2013 Jul 25. Free Radic Biol Med. 2013. PMID: 23891676
-
Functions and cellular compartmentation of the thioredoxin and glutathione pathways in yeast.Antioxid Redox Signal. 2013 May 1;18(13):1699-711. doi: 10.1089/ars.2012.5033. Epub 2013 Feb 5. Antioxid Redox Signal. 2013. PMID: 23198979 Free PMC article. Review.
Cited by
-
Glutathione and modulation of cell apoptosis.Biochim Biophys Acta. 2012 Oct;1823(10):1767-77. doi: 10.1016/j.bbamcr.2012.06.019. Epub 2012 Jun 23. Biochim Biophys Acta. 2012. PMID: 22732297 Free PMC article. Review.
-
Deciphering structural and functional roles of individual disulfide bonds of the mitochondrial sulfhydryl oxidase Erv1p.J Biol Chem. 2009 Oct 16;284(42):28754-61. doi: 10.1074/jbc.M109.021113. Epub 2009 Aug 13. J Biol Chem. 2009. PMID: 19679655 Free PMC article.
-
Yeast mitochondrial glutathione is an essential antioxidant with mitochondrial thioredoxin providing a back-up system.Free Radic Biol Med. 2016 May;94:55-65. doi: 10.1016/j.freeradbiomed.2016.02.015. Epub 2016 Feb 17. Free Radic Biol Med. 2016. PMID: 26898146 Free PMC article.
-
Mitochondrially targeted fluorescent redox sensors.Interface Focus. 2017 Apr 6;7(2):20160105. doi: 10.1098/rsfs.2016.0105. Interface Focus. 2017. PMID: 28382201 Free PMC article. Review.
-
Compartmentalization of metabolic pathways in yeast mitochondria improves the production of branched-chain alcohols.Nat Biotechnol. 2013 Apr;31(4):335-41. doi: 10.1038/nbt.2509. Epub 2013 Feb 17. Nat Biotechnol. 2013. PMID: 23417095 Free PMC article.
References
-
- Jones, D. P. (2006) Chem. Biol. Interact. 163 38-53 - PubMed
-
- Holmgren, A., Johansson, C., Berndt, C., Lonn, M. E., Hudemann, C., and Lillig, C. H. (2005) Biochem. Soc. Trans. 33 1375-1377 - PubMed
-
- Carmel-Harel, O., and Storz, G. (2000) Annu. Rev. Microbiol. 54 439-461 - PubMed
-
- Schafer, F. Q., and Buettner, G. R. (2001) Free Radic. Biol. Med. 30 1191-1212 - PubMed
-
- Hwang, C., Sinskey, A. J., and Lodish, H. F. (1992) Science 257 1496-1502 - PubMed
Publication types
MeSH terms
Substances
Grants and funding
LinkOut - more resources
Full Text Sources
Other Literature Sources
Molecular Biology Databases
