

Metabolic stress induces the lysosomal degradation of neuropilin-1 but not neuropilin-2
- PMID: 18708346
- PMCID: PMC2568914
- DOI: 10.1074/jbc.M804203200
Metabolic stress induces the lysosomal degradation of neuropilin-1 but not neuropilin-2
Abstract
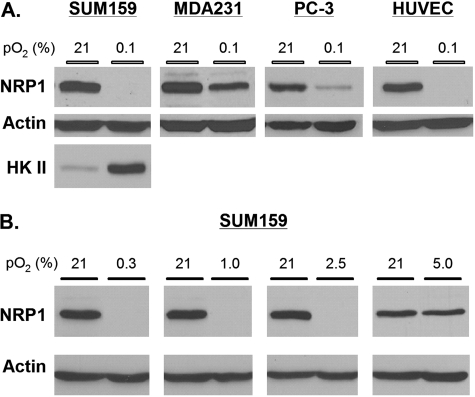
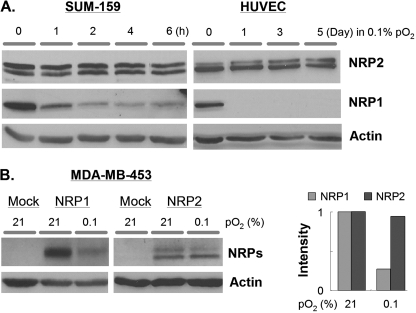
The neuropilins-1 and -2 (NRP1 and NRP2) function as receptors for both the semaphorins and vascular endothelial growth factor. In addition to their contribution to the development of the nervous system, NRP1 and NRP2 have been implicated in angiogenesis and tumor progression. Given their importance to cancer and endothelial biology and their potential as therapeutic targets, an important issue that has not been addressed is the impact of metabolic stress conditions characteristic of the tumor microenvironment on their expression and function. Here, we demonstrate that hypoxia and nutrient deprivation stimulate the rapid loss of NRP1 expression in both endothelial and carcinoma cells. NRP2 expression, in contrast, is maintained under these conditions. The lysosomal inhibitors chloroquine and bafilomycin A1 prevented the loss of NRP1 expression, but proteasomal inhibitors had no effect. The hypothesis that NRP1 is degraded by autophagy is supported by the findings that its expression is lost rapidly in response to metabolic stress, prevented with 3-methyladenine and induced by rapamycin. Targeted depletion of NRP2 using small hairpin RNA revealed that NRP2 can function in the absence of NRP1 to mediate endothelial tube formation in hypoxia. Studies aimed at assessing NRP function and targeted therapy in cancer and angiogenesis should consider the impact of metabolic stress.
Figures


Similar articles
-
Neuropilin-1 and neuropilin-2 act as coreceptors, potentiating proangiogenic activity.Blood. 2008 Feb 15;111(4):2036-45. doi: 10.1182/blood-2007-04-084269. Epub 2007 Dec 7. Blood. 2008. PMID: 18065694
-
Neuropilin-1 and neuropilin-2 expression in the adenoma-carcinoma sequence of colorectal cancer.Histopathology. 2013 May;62(6):908-15. doi: 10.1111/his.12098. Epub 2013 Mar 28. Histopathology. 2013. PMID: 23551578
-
Neuropilin-1 and neuropilin-2 are differentially expressed in human proteinuric nephropathies and cytokine-stimulated proximal tubular cells.Lab Invest. 2009 Nov;89(11):1304-16. doi: 10.1038/labinvest.2009.96. Epub 2009 Sep 7. Lab Invest. 2009. PMID: 19736548
-
Neuropilins in neoplasms: expression, regulation, and function.Exp Cell Res. 2006 Mar 10;312(5):584-93. doi: 10.1016/j.yexcr.2005.11.024. Epub 2006 Jan 27. Exp Cell Res. 2006. PMID: 16445911 Review.
-
The interaction of Neuropilin-1 and Neuropilin-2 with tyrosine-kinase receptors for VEGF.Adv Exp Med Biol. 2002;515:81-90. doi: 10.1007/978-1-4615-0119-0_7. Adv Exp Med Biol. 2002. PMID: 12613545 Review.
Cited by
-
Neuropilin-2 regulates α6β1 integrin in the formation of focal adhesions and signaling.J Cell Sci. 2012 Jan 15;125(Pt 2):497-506. doi: 10.1242/jcs.094433. Epub 2012 Feb 2. J Cell Sci. 2012. PMID: 22302985 Free PMC article.
-
Overexpression of VEGF189 in breast cancer cells induces apoptosis via NRP1 under stress conditions.Cell Adh Migr. 2011 Jul-Aug;5(4):332-43. doi: 10.4161/cam.5.4.17287. Cell Adh Migr. 2011. PMID: 21897119 Free PMC article.
-
Tumor cell response to bevacizumab single agent therapy in vitro.Cancer Cell Int. 2013 Sep 23;13(1):94. doi: 10.1186/1475-2867-13-94. Cancer Cell Int. 2013. PMID: 24059699 Free PMC article.
-
Orchestrating Resilience: How Neuropilin-2 and Macrophages Contribute to Cardiothoracic Disease.J Clin Med. 2024 Mar 1;13(5):1446. doi: 10.3390/jcm13051446. J Clin Med. 2024. PMID: 38592275 Free PMC article. Review.
-
Neuropilin-1 Facilitates Pseudorabies Virus Replication and Viral Glycoprotein B Promotes Its Degradation in a Furin-Dependent Manner.J Virol. 2022 Oct 26;96(20):e0131822. doi: 10.1128/jvi.01318-22. Epub 2022 Sep 29. J Virol. 2022. PMID: 36173190 Free PMC article.
References
-
- Kolodkin, A. L., Levengood, D. V., Rowe, E. G., Tai, Y. T., Giger, R. J., and Ginty, D. D. (1997) Cell 90 753–762 - PubMed
-
- He, Z., and Tessier-Lavigne, M. (1997) Cell 90 739–751 - PubMed
-
- Soker, S., Takashima, S., Miao, H. Q., Neufeld, G., and Klagsbrun, M. (1998) Cell 92 735–745 - PubMed
-
- Neufeld, G., Kessler, O., and Herzog, Y. (2002) Adv. Exp. Med. Biol. 515 81–90 - PubMed
Publication types
MeSH terms
Substances
Grants and funding
LinkOut - more resources
Full Text Sources
Miscellaneous
