HIV-induced type I interferon and tryptophan catabolism drive T cell dysfunction despite phenotypic activation
- PMID: 18698365
- PMCID: PMC2491901
- DOI: 10.1371/journal.pone.0002961
HIV-induced type I interferon and tryptophan catabolism drive T cell dysfunction despite phenotypic activation
Abstract
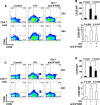
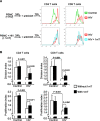
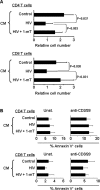
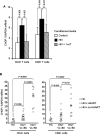
Infection by the human immunodeficiency virus (HIV) is characterized by functional impairment and chronic activation of T lymphocytes, the causes of which are largely unexplained. We cultured peripheral blood mononuclear cells (PBMC) from HIV-uninfected donors in the presence or absence of HIV. HIV exposure increased expression of the activation markers CD69 and CD38 on CD4 and CD8 T cells. IFN-alpha/beta, produced by HIV-activated plasmacytoid dendritic cells (pDC), was necessary and sufficient for CD69 and CD38 upregulation, as the HIV-induced effect was inhibited by blockade of IFN-alpha/beta receptor and mimicked by recombinant IFN-alpha/beta. T cells from HIV-exposed PBMC showed reduced proliferation after T cell receptor stimulation, partially prevented by 1-methyl tryptophan, a competitive inhibitor of the immunesuppressive enzyme indoleamine (2,3)-dioxygenase (IDO), expressed by HIV-activated pDC. HIV-induced IDO inhibited CD4 T cell proliferation by cell cycle arrest in G1/S, and prevented CD8 T cell from entering the cell cycle by downmodulating the costimulatory receptor CD28. Finally, the expression of CHOP, a marker of the stress response activated by IDO, was upregulated by HIV in T cells in vitro and is increased in T cells from HIV-infected patients. Our data provide an in vitro model for HIV-induced T cell dysregulation and support the hypothesis that activation of pDC concomitantly contribute to phenotypic T cell activation and inhibition of T cell proliferative capacity during HIV infection.
Conflict of interest statement
Figures


Similar articles
-
HIV inhibits CD4+ T-cell proliferation by inducing indoleamine 2,3-dioxygenase in plasmacytoid dendritic cells.Blood. 2007 Apr 15;109(8):3351-9. doi: 10.1182/blood-2006-07-034785. Epub 2006 Dec 7. Blood. 2007. PMID: 17158233 Free PMC article. Clinical Trial.
-
Allostimulatory activity of bone marrow-derived plasmacytoid dendritic cells is independent of indoleamine dioxygenase but regulated by inducible costimulator ligand expression.Hum Immunol. 2009 May;70(5):313-20. doi: 10.1016/j.humimm.2009.01.021. Epub 2009 Feb 3. Hum Immunol. 2009. PMID: 19208362 Free PMC article.
-
Chloroquine modulates HIV-1-induced plasmacytoid dendritic cell alpha interferon: implication for T-cell activation.Antimicrob Agents Chemother. 2010 Feb;54(2):871-81. doi: 10.1128/AAC.01246-09. Epub 2009 Nov 30. Antimicrob Agents Chemother. 2010. PMID: 19949061 Free PMC article.
-
How does indoleamine 2,3-dioxygenase contribute to HIV-mediated immune dysregulation.Curr Drug Metab. 2007 Apr;8(3):217-23. doi: 10.2174/138920007780362527. Curr Drug Metab. 2007. PMID: 17430110 Review.
-
Indoleamine-2, 3-dioxygenase and other interferon-gamma-mediated pathways in patients with human immunodeficiency virus infection.Curr Drug Metab. 2007 Apr;8(3):225-36. doi: 10.2174/138920007780362608. Curr Drug Metab. 2007. PMID: 17430111 Review.
Cited by
-
HIV-1 Infection Results in Sphingosine-1-Phosphate Receptor 1 Dysregulation in the Human Thymus.Int J Mol Sci. 2023 Sep 8;24(18):13865. doi: 10.3390/ijms241813865. Int J Mol Sci. 2023. PMID: 37762169 Free PMC article.
-
HIV-1-Host Interaction in Gut-Associated Lymphoid Tissue (GALT): Effects on Local Environment and Comorbidities.Int J Mol Sci. 2023 Jul 30;24(15):12193. doi: 10.3390/ijms241512193. Int J Mol Sci. 2023. PMID: 37569570 Free PMC article. Review.
-
SARS CoV-2 infection as a risk factor of preeclampsia and pre-term birth. An interplay between viral infection, pregnancy-specific immune shift and endothelial dysfunction may lead to negative pregnancy outcomes.Ann Med. 2023 Dec;55(1):2197289. doi: 10.1080/07853890.2023.2197289. Ann Med. 2023. PMID: 37074264 Free PMC article. Review.
-
Reshaping the tumor microenvironment with oncolytic viruses, positive regulation of the immune synapse, and blockade of the immunosuppressive oncometabolic circuitry.J Immunother Cancer. 2022 Jul;10(7):e004935. doi: 10.1136/jitc-2022-004935. J Immunother Cancer. 2022. PMID: 35902132 Free PMC article.
-
Anti-type I interferon antibodies as a cause of severe COVID-19.Fac Rev. 2022 Jun 10;11:15. doi: 10.12703/r-01-0000010. eCollection 2022. Fac Rev. 2022. PMID: 35812362 Free PMC article.
References
-
- Vergis EN, Mellors JW. Natural history of HIV-1 infection. Infect Dis Clin North Am. 2000;14:809–825, v–vi. - PubMed
-
- Dickmeiss E. Immunology of the human immunodeficiency virus infection. Tokai J Exp Clin Med. 1990;15:263–267. - PubMed
-
- Gougeon ML. Chronic activation of the immune system in HIV infection: contribution to T cell apoptosis and V beta selective T cell anergy. Curr Top Microbiol Immunol. 1995;200:177–193. - PubMed
-
- Finkel TH, Banda NK. Indirect mechanisms of HIV pathogenesis: how does HIV kill T cells? Curr Opin Immunol. 1994;6:605–615. - PubMed
-
- Finkel TH, Tudor-Williams G, Banda NK, Cotton MF, Curiel T, et al. Apoptosis occurs predominantly in bystander cells and not in productively infected cells of HIV- and SIV-infected lymph nodes. Nat Med. 1995;1:129–134. - PubMed
Publication types
MeSH terms
Substances
Grants and funding
LinkOut - more resources
Full Text Sources
Other Literature Sources
Medical
Research Materials

